

Consider this. China’s $14.72 trillion GDP was almost five times India’s $2.66 trillion GDP in 2020.
However, China’s $528 billion corporate income tax (CIT) revenues were 8.5 times India’s $62 billion!
This is despite China’s peak CIT rate of 25 per cent being similar to India’s concessional rate of 25.168 per cent and the lower than India’s peak rate of 35 per cent, which is adopted by companies contributing to nearly 40 per cent of total income.
While peak CIT rates in India and The Philippines are among the highest in Asia, India’s CIT-to-GDP ratio was the lowest among the seven nations at 2.31 per cent in FY2021 and second lowest at 2.68 per cent in FY2022 (Figure 1).
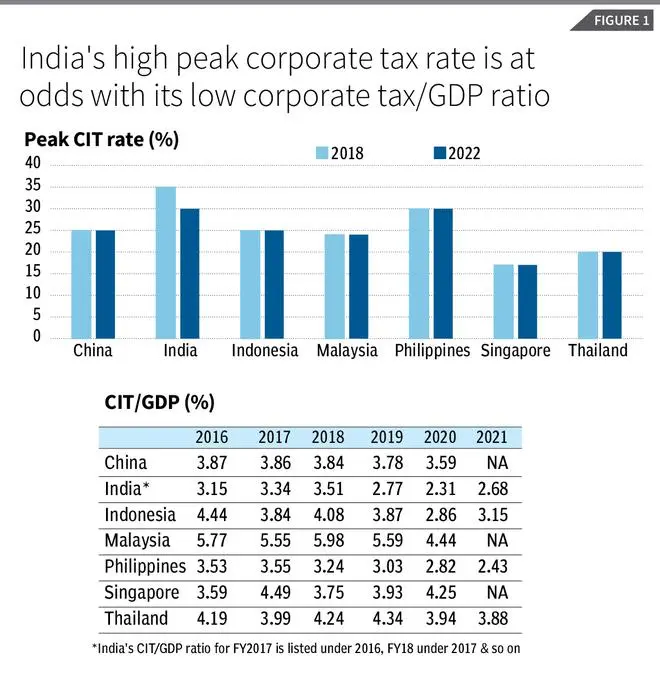
However, this data must be interpreted with caution. India’s peak 30 per cent CIT plus applicable surcharge and cess takes the effective CIT to 34.94 per cent.
Companies opting to pay the peak rate may avail themselves of a plethora of deductions to reduce tax expense, which makes the computation complex and convoluted.
From FY2020, the government gave CIT payers, which includes banks, an option to choose a lower tax regime, which entails a 22 per cent CIT plus surcharge and cess translating to an effective tax rate (ETR) of 25.168 per cent, provided they forego all deductions.
The advantages of a deduction-free lower CIT include a lower ETR for tax payers and a degree of certainty in forecasting tax revenues as the ETR is closer to the stated tax rate. .
Low CIT buoyancy
The government may have expected CIT revenue buoyancy to improve once it gave companies the option to pay a deduction-free lower rate. However, India’s CIT-revenues-to-GDP ratio in FY2022 was 2.68 per cent — lower than the 6-year peak of 3.51 per cent in FY2018.
This is despite CIT revenues growing by a robust 39 per cent since FY2021 to ₹6.35-lakh crore ($85 billion), which is still 4 per cent lower than the ₹6.64-lakh crore ($97 billion) in FY2019.
The Laffer Curve, a concept which postulates that a cut in tax rate will spur economic activity and through a multiplier effect increase tax revenues, does not seem to apply to India’s CIT revenues.
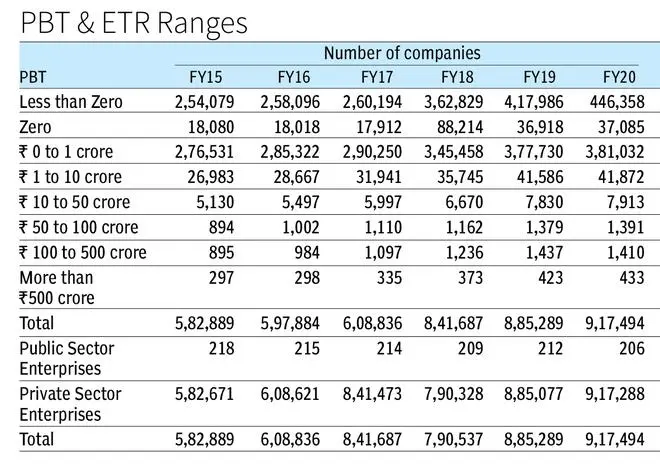
Two factors impede CIT revenue growth. First, the share of companies that reported negative profit before tax (PBT) and zero PBT has risen to 49 per cent (FY2015: 44 per cent) and 4 per cent (FY2015: 3 per cent) respectively in FY2020.
More than half the companies in India, a number which grew by 57 per cent to 9,17,494 in FY2020, pay zero CIT!
The share of companies reporting a meagre PBT of less than ₹1.0 crore despite declining to 42 per cent in FY2020 (FY2015: 47 per cent) continues to be high. Second, reported PBT and ETR are inversely related. Between FY2015 and FY2020, the ETR of companies with higher than ₹500 crore PBT was consistently lower than that of companies reporting nil to ₹10 crore PBT (Figure 2).
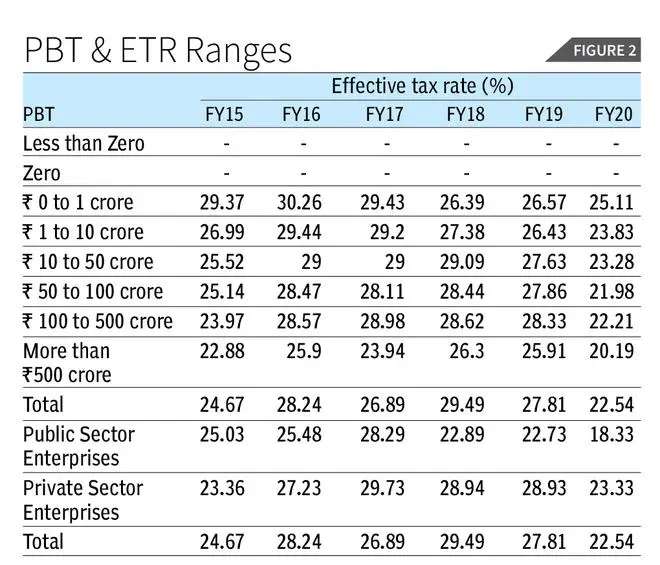
ETR is the tax expense expressed as a percentage of PBT. The FY2020 data supports the premise that companies reporting lower PBT pay taxes at the peak rate and avail of deductions, while those reporting higher PBT have opted for the deduction-free lower CIT.
Largest firms, mixed trend
We analysed 59 entities (Figure 3), comprising Nifty50 constituents and nine other listed entities, to understand India’s sub-optimal CIT revenue buoyancy.
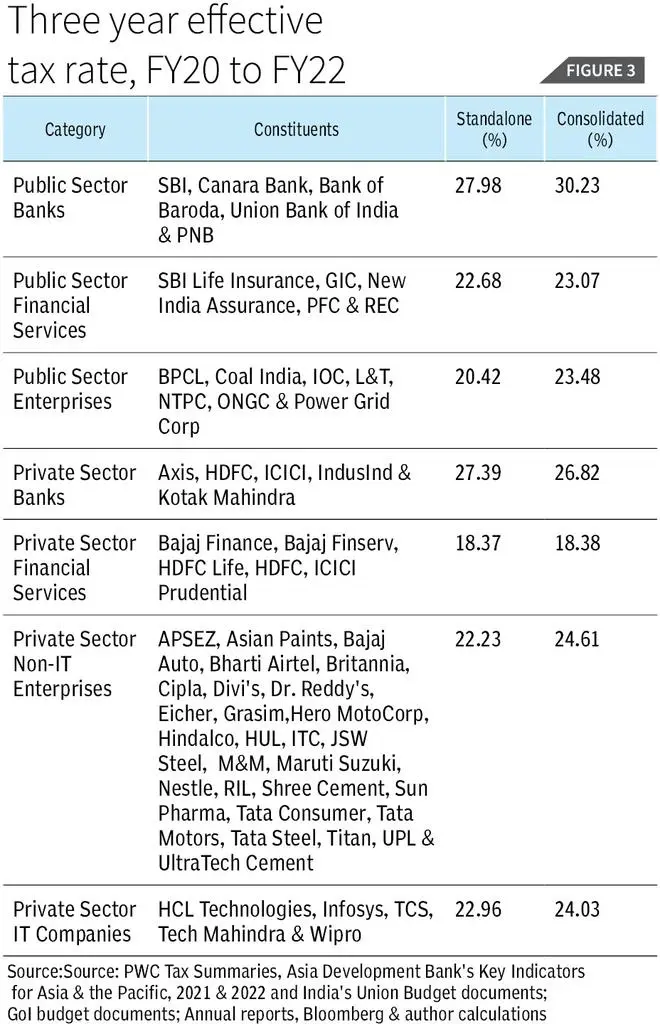
We divided the Nifty50 constituent companies into seven categories — public sector banks (PSB), public sector financial services (PFS), public sector enterprises (PSE), private sector banks (PVB), private sector financial services (PVFS), private sector non-IT enterprises (PVNIT), and private sector IT enterprises (PVIT).
We added the largest listed entities by market capitalisation that are not constituents of the Nifty50 to the PSB, PFS and PVFS categories so that all seven categories comprised at least five entities each.
Four takeaways
There are four key takeaways from our analysis.
First, the holding companies of the 59 entities surveyed accounted for 70 to 77 per cent of consolidated PBT and 64 to 72 per cent of consolidated tax expense between FY2018 and FY2022. Hence, the standalone PBT and tax expense reported by the holding companies are the dominant drivers of the consolidated metrics.
Second, the standalone and consolidated ETRs of India’s 59 largest companies is lower than the 25.168 per cent statutory CIT. Most large profit-making companies have adopted the reduced rate.
Third, the average annual growth (AAG) of standalone and consolidated PBT outstripped that of the tax expense between FY2020 and FY2022; after the 25.168 per cent CIT was introduced in FY2020. Standalone AAG of PBT and tax expense was 20.20 and 17.81 per cent respectively.
Consolidated AAG of PBT and tax expense was 23.41 and 15.8 per cent respectively.
This implies that the incremental tax expense of the 59 largest listed entities for every ₹100 of PBT was ₹24.44 and ₹20.56 on a standalone and consolidated basis, which is lower than the 25.168 per cent deduction-free CIT.
Fourth, PSBs reported the highest standalone and consolidated three-year (FY2020 to FY2022) ETR of 27.98 and 30.23 per cent respectively (Figure 3), which was higher than the more profitable PVSBs’ ETRs. This was contrary to our expectation that the immensely profitable, cash rich and low-leveraged IT companies would report the highest ETRs.
The standalone and consolidated ETR of the IT companies was lower than the 59-sample average and the 25.168 per cent CIT.
The PSEs, which include the oil marketing companies, also reported ETRs lower than the 59-sample average and the 25.168 per cent CIT. PVFS firms reported the lowest standalone and consolidated ETRs of 18.37 and 18.38 per cent respectively as HDFC Life Insurance and ICICI Prudential Life Insurance reported ETRs of less than 10 per cent for most of the three-year period.
Way forward
The government needs to adopt a two-pronged strategy to make it worthwhile for corporates to report their performance accurately and to improve CIT revenue buoyancy. First, the feasibility of introducing a two-tier deduction-free structure that comprises 15 per cent CIT for companies with PBT up to ₹50 crore and 25 per cent for companies reporting PBT over ₹50 crore must be assessed.
Second, the government must consider expanding the scope of the Small Industries Development Bank of India to include a First Loss Default Guarantee vertical tasked with reimbursing banks for defaults by profitable MSMEs with at least a three-year CIT paying track record a fraction of the principal outstanding.
Such a move would improve credit access to MSMEs at competitive interest rates and incentivise them to report their performance accurately.
Veeraraghavan is a Partner at Sammati Consulting and Analytics LLP. Vijayaraghavan is Head of Research at Korea Development Bank . Views expressed are personal
![]() Comments
Comments


Comments
Comments have to be in English, and in full sentences. They cannot be abusive or personal. Please abide by our community guidelines for posting your comments.
We have migrated to a new commenting platform. If you are already a registered user of TheHindu Businessline and logged in, you may continue to engage with our articles. If you do not have an account please register and login to post comments. Users can access their older comments by logging into their accounts on Vuukle.