

How is one to interpret the GDP numbers for Q1 FY23? A 13.5 per cent growth is quite impressive. However, when one considers that in Q1-FY22 there was a semi-lockdown in the country, when services in particular faced considerable restrictions, the enthusiasm is moderated. Also, it should be remembered that 2020 was a lockdown year, especially in the first quarter when there was virtually no economic activity in several sectors in the first two months.
The narrative hence gets confusing as there are base effects which come in. Hopefully, after FY23, this factor should play a less significant part in influencing the growth numbers.
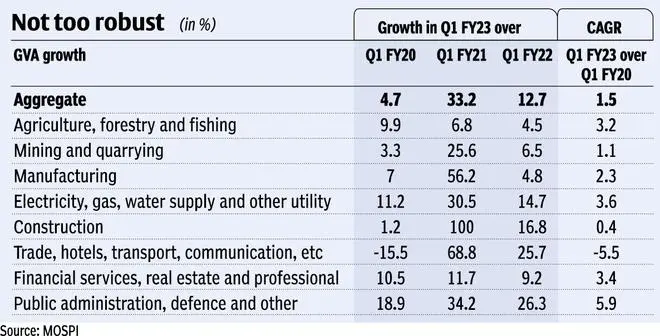
A way out is to compare GVA (gross value added) growth in Q1 FY23 across sectors over the last three years — Q1 FY20, Q1 FY21 and Q1 FY22. This will provide a better picture of how the economy has fared. Also, to even out the troughs and peaks in growth numbers due to the pandemic and lockdown and the subsequent spikes in numbers, an average annual compound growth rate has been calculated for these sectors in the last three years.
The Table shows that while growth numbers over Q1 FY21 and Q1 FY22 are impressive, the picture is moderated considerably when compared with Q1 FY20 which was a normal year. Overall growth comes down from 12.7 per cent to 4.7 per cent. Agriculture, utilities and financial services and real estate are the three sectors which display robust growth over a normal base. The leading sector is public administration and other services where the government has relentlessly been increasing its breadth to keep the economy ticking.
Trade, hotels lag
Growth is anaemic for mining and construction while still in negative zone for trade, hotels, etc. This is significant because it means that this segment has not yet returned to normal notwithstanding the boom seen in the PMI (services) numbers this year, which are impressive.
The last column gives the compounded growth rate in the last three years which comes in at 1.5 per cent for the economy. This is indicative of limited pick-up in the last two years given that FY21 was a period of negative growth.
In fact, the CAGR was highest for the government sector at 5.9 per cent followed by electricity, financial services and agriculture which were each above 3 per cent. It is negative for trade, transport, etc., and just about positive for construction. Manufacturing is also low at 2.3 per cent.
Some conclusions that can be drawn are: First, the double digit growth rate does not really mean much as it is a statistical phenomenon. Second, if we have grown at just 1.5 per cent in the last three years, it means that there is a long way to go before the economy enters a phase of higher growth. Therefore, while 7.2 per cent growth this year is still feasible, it will mean more of recouping losses of FY21 and and FY22 rather than pushing on the pedal for acceleration.
Third, the trade and hotels segment is still down. Trade and transport are important components here which are related directly to the overall state of the economy. But on the positive side this can be indicative that there could still be some pent up demand in this segment that can be leveraged in the coming quarters, which is a good signal for the industries considered.
Another interesting aspect of the Q1 numbers is that nominal GDP growth was 26.7 per cent against 13.5 per cent growth in real GDP. This means that the GDP deflator, which is another measure of inflation was substantially high at 13.2 per cent. This is the highest deflator in the last 15 years or so.
Inflation worries
Also, since Q1-FY22, the GDP deflator has been in double digits in all the quarters. This is disturbing because while monetary policy is tuned towards CPI inflation and the target of 6 per cent has been breached, the GDP deflator narrates a different picture. It also means that when considering monetary policy there can be an argument to reconsider an appropriate inflation metric as the GDP deflator seems more aligned with the WPI rather than CPI. The other disturbing aspect of the GDP numbers for this quarter is rising trade deficit. At minus 5.3 per cent of GDP (share in total), it is the highest since June 2013. Therefore, while exports is not a major contributor to GDP as the economy is domestically-oriented, the high deficit would finally get reflected in a widening current account deficit which looks likely to be upwards of 3 per cent of GDP in FY23. This is something we need to be prepared for this year.
The high growth in nominal terms is hence not exactly a positive for us even if it helps the nation on the path to becoming a $5 trillion economy; the high share of inflation is not desirable. The increase in gross fixed capital formation rate to 29.2 per cent in encouraging though the contribution appears to be more from the side of the government.
The high GST collections this year reflect revival in consumption. But given the negative growth in the trade, hotels segment as well as low growth in manufacturing, it is more a case of consumption still getting back to its earlier level. In fact, in real terms while consumption has increased by 26 per cent over Q1 FY22, it gets moderated to just about 10 per cent when compared with Q1 FY20.
Therefore, the GDP performance suggests that we are still in the process of getting out of the morass which was largely a result of the lockdowns in 2020 and 2021. And, more importantly, this will also be the picture emerging for the subsequent quarters where the growth numbers will tend to also be lower than the current one.
The writer is Chief Economist, Bank of Baroda. Views are personal
![]() Comments
Comments


Comments
Comments have to be in English, and in full sentences. They cannot be abusive or personal. Please abide by our community guidelines for posting your comments.
We have migrated to a new commenting platform. If you are already a registered user of TheHindu Businessline and logged in, you may continue to engage with our articles. If you do not have an account please register and login to post comments. Users can access their older comments by logging into their accounts on Vuukle.