
The bellwether Sensex and Nifty 50 indices have begun year 2023 on a weak note. Major Asian indices such as the Nikkei 225 and Shanghai Composite are up over 5 and 7 per cent (year-to-date) respectively. In the US, the Dow Jones Industrial average has recovered all its loss made earlier this year and is up just over a per cent now. Germany’s DAX has surged over 12 per cent so far this year. In contrast, the Sensex and Nifty are down 1.7-2.8 per cent.
While one more leg of down-move cannot be ruled out, the strong recovery in the Sensex and Nifty over the last couple of weeks has given some relief. The time looks ripe for investors to start entering the markets from a long-term perspective.
We use this opportunity to assess indices beyond the bellwethers, using technical analysis, and see which ones make for interesting investments at this juncture. Investors have options to take exposure to some of these indices through index funds and ETFs.
Nifty 100: Buy now and accumulate on dips
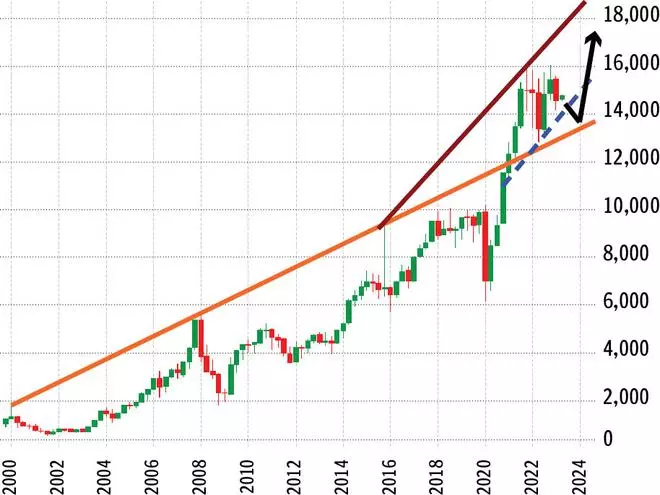
The Nifty 100 (17,414.65) index made a new high of 19,039.40 in December last year. Thereafter, the index has been trending downwards. The downtrend is still intact. Immediate resistance is at 17,450. Above that 17,570 and 17,830 are the next important resistances. So broadly, as long as the Nifty 100 index stays below 18,000, the downtrend will continue to remain intact.

Outlook

One more leg of fall from any of the resistances mentioned above can take the index down to 16,350 or even 16,000. This fall can happen in this quarter (April-June). But such a fall will be a good opportunity to buy the Nifty 100 index. The level of 16,000 is a very important trendline support. A strong trigger might be needed to break this support.
We expect the index to sustain above 16,000. A fresh rally thereafter will have the potential to take the Nifty 100 index up to 19,000-19,200 by the first or second quarter next year. From a very long-term perspective, an eventual break above 19,200 will pave the way for a test of 22,000 and higher levels, going forward.
To avoid the fall to 16,000, the index has to make a strong close above 17,750 in April. Thereafter a strong follow-through rise above 18,000 can take it straight away towards 19,000-19,200 much quicker.
Strategy
Long-term investors can get into this index in tranches. Since there is room for one more leg of fall, buy 30 per cent of the intended amount at current levels. Buy another 50 per cent at 16,400 and the balance 20 per cent at 16,150. In case a rise to 17,750 happens in April, then buy the balance 70 per cent at 17,850.
Nifty 500: Buy on dips
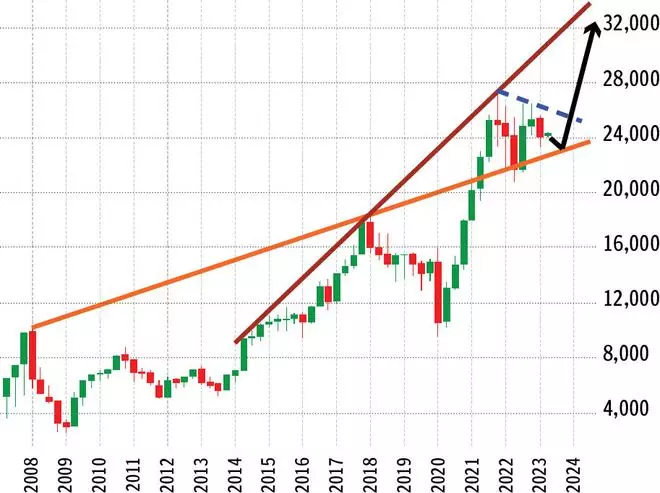
The Nifty 500 (14,759.20) index is facing strong resistance at 16,000. The quarterly candles show that since the fourth quarter of 2021, the index has been struggling to breach the 16,000-mark. The index made a high of 16,041.65 in December last year and has been coming down since then. Immediate resistance is in the 14,800-15,000 region. Above that, 15,200-15,400 is the next key resistance zone. As long as the index stays below 15,400, the downtrend will remain intact.
Outlook
Nifty 500 index has room to fall further. It can test the intermediate support at 14,200-14,170 again. A break below 14,170 can drag the index down to 13,500 and even 13,000 in the worst case. This fall can happen either in this quarter (April-June) or in the next. Nifty 500 index can find a bottom anywhere in the 13,500-13,000 region. A fresh rally thereafter can take the index back towards 16,000.
A decisive monthly close above 16,000 will boost the bullish momentum. Such a break will pave the way for a fresh rise to 19,000 and higher levels over the long term.
Strategy
Investors should wait to buy this index. Buy 20 per cent of the intended amount at 14,100. Another 60 per cent can be bought at 13,600. The balance 20 per cent can be deployed at 13,200.
Nifty Next 50: Buy now and accumulate on dips
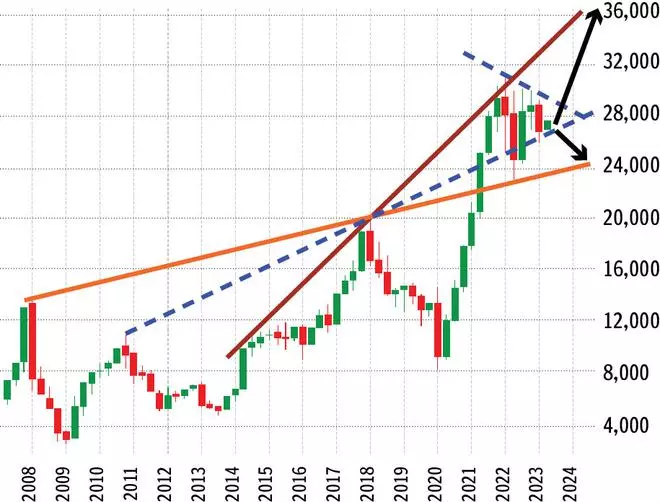
The Nifty Next 50 (38,187.05) made a high of 45,509 in September last year and has come off sharply from there. The price action on the long-term charts indicates that the index had failed to breach 44,000 decisively in its several attempts made since October 2021. The region between 44,500 and 45,500 is a strong resistance zone. The index has to see a sustained break above 45,500 to bring back the bullish momentum.

Outlook
The trend has been down since September last year. However, there is not much room left on the downside. The price action on the weekly chart gives an initial sign of a base formation above 37,000. So, there is a chance for a rise to 39,500-40,000 in the short term. But whether that will be a trend reversal or just a corrective bounce is not going to be clear at the moment.
However, on the monthly chart, there is still little room left on the downside. Supports are at 36,150 and 35,500. One more leg of fall to 36,150 or 35,500 cannot be ruled out — either from here itself or after a corrective rise to 40,000. However, a fall beyond 35,500 is less likely.
So, a fresh rally from either 36,150 or 35,500 can take the Nifty Next 50 index up towards 45,500 again by the final quarter of this year. A decisive break above 45,500 will then open doors for the Nifty Next 50 index to target 54,000-56,000 over the long term.
Strategy
There is not much room left on the downside from here. Also, there is a sign of a base formation. So, we suggest buying the Nifty Next 50 index at current levels. Buy 70 per cent of the intended amount now. The balance 30 per cent can be bought at 36,250.
Nifty SmallCap 250 and Nifty MidCap 150 are the other two indices that we considered for our study. But since these two indices have limited historical data, to do a detailed analysis, we have taken the BSE MidCap and BSE SmallCap indices as a proxy for Nifty MidCap 150 and Nifty SmallCap 250 indices respectively. Directionally they move together. So, investors can make a note of the levels given below for the BSE MidCap and BSE SmallCap indices and correspondingly invest in the Nifty MidCap 150 and Nifty SmallCap 250.
BSE MidCap: Buy now
The BSE MidCap (24,351.06) index made a low of 23,356.61 last month and has risen back well from there. This upmove is significant as it has happened from around an important support level. However, there is no confirmation yet on a strong trend reversal. So, we will have to wait and watch the price action in the coming weeks to get clarity on that.
Outlook
Strong supports are at 23,000 and 22,700. So, there are good chances that the BSE MidCap index could have formed a bottom already. But, to get an initial confirmation on that, the index has to rise past 25,000 decisively from here. That will increase the chances for the index to test the crucial resistance level of 26,500.
A strong monthly close above 26,500 will strengthen the bullish momentum. In that case, the BSE MidCap index can target 31,500-32,000 over the long term.
On the other hand, failure to breach 25,000 from here can drag the index down to 23,500-23,000 again. However, as mentioned above, 23,000 and 22,700 are strong supports. So, a fall beyond 22,700 is less probable.
Strategy
The BSE MidCap index is a good buy at current levels itself. Investors can deploy 75 per cent of the intended amount at current levels. The balance 25 per cent can be bought either at 25,300 or at 23,200, whichever happens first.
BSE SmallCap index: Buy in tranches
The BSE SmallCap (27,725.34) made a low of 26,120.32 last month and has risen back very well. This bounce has happened from just below a key trendline support level of 26,650. This gives some hope that the downtrend that was in place since December last year might have ended. However, a strong follow-through rise from current levels is needed to confirm the same.
Outlook
A crucial near-term resistance is at 28,600. If the index makes a strong close above this, it will then strengthen the case for a trend reversal. In that case, a rise to 29,600 and even 30,400 can be seen thereafter.
The level of 30,400 will be the next key resistance to watch. The rise above 28,600 will increase the chances of the index breaching 30,400 as well. A strong follow-through rise above 30,400 will then see the BSE SmallCap index targeting 34,500-35,500 over the long term.
However, more caution is needed in case the index fails to break 28,600 immediately. That can drag the index down to test 26,650 — the crucial trend line support. A strong break below 26,500 will increase the selling pressure and will be very bearish. Such a break will increase the danger of the BSE SmallCap index tumbling towards 24,000, going forward.
But, for such a fall to happen, some new and a strong negative trigger is needed. At the moment, all the negative news — such as the interest rate hikes, global slowdown, recession in the US — is already factored in the market. So, as such, we expect the recent bounce in the BSE SmallCap index to sustain and move higher.
Strategy
Since the chance of a steeper fall to 24,000 is still a threat, we suggest investors buy the BSE SmallCap index in tranches. Investors can buy 60 per cent of the intended amount at current levels. The balance 40 per cent can be bought at 29,100. In case the index reverses down from around 28,600 and breaks below 26,500, then investors have to wait for the level of 24,200 to deploy the balance 40 per cent.
![]() Comments
Comments


Comments
Comments have to be in English, and in full sentences. They cannot be abusive or personal. Please abide by our community guidelines for posting your comments.
We have migrated to a new commenting platform. If you are already a registered user of TheHindu Businessline and logged in, you may continue to engage with our articles. If you do not have an account please register and login to post comments. Users can access their older comments by logging into their accounts on Vuukle.