

The Russia-Ukraine conflict has triggered a broad-based correction in Indian stocks, providing a good entry point for investors looking to add to their equity allocations or average the cost of equity holdings. But during such situations, events often unfold with such rapidity that you do not have the time to do due diligence on direct stock picks or active fund choices.
Lumpsum investments in index funds can be a good choice to capitalise on such opportunities. We recommend that investors use the recent correction to buy into Nifty Midcap 150 index. While there are a few ETFs and open-end funds mirroring this index, we suggest buying into Motilal Oswal Nifty Midcap 150 Index Fund, given its longer record and competitive costs. We prefer open-end index funds over ETFs because market prices of ETFs can move way off NAV during turbulent market phases and may offer limited liquidity.
Why this index
Four factors argue for investing in the Nifty Midcap 150 over other indices or fund alternatives.
One, with considerable domestic and foreign money flowing into headline indices, the top 100 stocks in the Indian listed universe are now over-researched and over-owned. Flagship large-cap and multicap funds also end up owning sizeable weights in these stocks. This makes the Nifty Midcap 150 Index a good addition for investors who would like to avoid overlaps with their existing large-cap or multi-cap equity funds. After sorting all the stocks in the listed universe based on full market cap, the top 100 are swept into the Nifty 100 index, while the next 150 stocks go into this index.
Two, the Nifty Midcap 150 portfolio features less sector and stock concentration than the Nifty 100. As of end-February 2022, the Nifty Midcap 150 had financial services (16.2 per cent), consumer goods (10.9 per cent), industrial manufacturing (9.9 per cent), automobiles (8.7 per cent) and IT (8 per cent) as its top weights. Adani Total Gas, Tata Power, SRF, Voltas and AU Small Finance Bank at weights of 1-3 per cent were its top stocks. In contrast, the Nifty 100 has its top weights in financials (33 per cent), IT (15 per cent), oil and gas and consumer goods (11 per cent each). Top stocks holdings in Nifty 100 carry higher weights of 5-9.5 per cent.
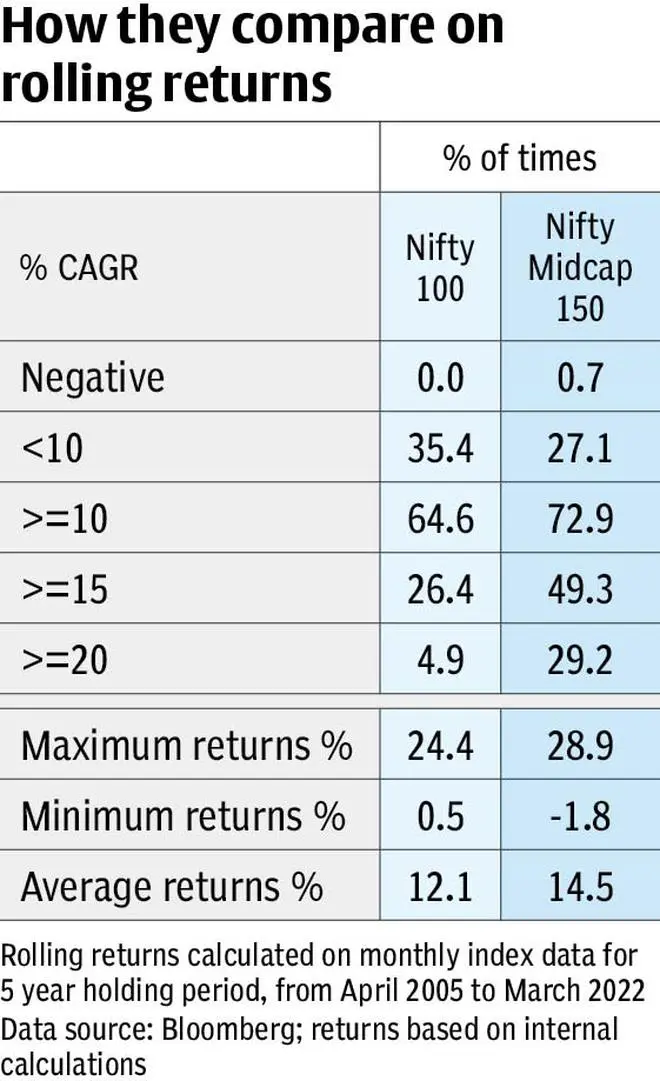
Three, a rolling return analysis of the Nifty Midcap 150 index against the Nifty 100 (on a total return basis) suggests that the midcap index offers higher return potential with manageable risks, if you are willing to hold for five years plus.
Based on a monthly 5-year rolling return analysis on data from April 2005 to March 2022, the Nifty Midcap 150 generated an average CAGR of 14.5 per cent against 12.1 per cent on the Nifty 100. The Nifty Midcap 150 index also generated more than a 15 per cent CAGR nearly 49 per cent of the time, while the Nifty 100 managed this only 26 per cent of the time. The probability of losses on the two indices were at zero for Nifty 100 and 0.7 per cent for the Nifty Midcap 150. Minimum 5-year returns on the mid-cap index were at a negative 1.8 per cent against a positive 0.5 per cent on the Nifty 100.
Four, buying an index fund to play mid-caps helps investors get around the problem of expanding size that undermines performance in the more successful active mid-cap funds. Currently, leading active funds in the midcap category manage assets of ₹15000-₹35000 crore compared to the sub-₹500 crore assets of the Motilal Oswal Nifty Midcap 150 Fund. The low expense ratio on index funds relative to active funds acts as a kicker to returns. The current expense ratio on Motilal Oswal Nifty Midcap 150 fund’s regular plan is 1.01 per cent and direct plan is 0.21 per cent, which compares well to peers in this category.
Negatives
While the Nifty Midcap 150 index offers good return potential for long-term investors, it also carries higher risks.
One, the valuation of the basket of stocks that make up the Nifty Midcap 150, at PE of 26 times as of March 10, is currently at a premium to the Nifty 100 (21 times), while it ought to be the reverse. This could aggravate near-term downside in the index if the correction prolongs or deepens. The higher PE, though, is partly explained by the Midcap 150 featuring a lower weight to energy and metal stocks that occupy bigger weights in the Nifty 100.
Two, during short-term market drawdowns such as in 2008 or 2011 the Nifty Midcap 150 has subjected investors to much bigger losses than the Nifty 100. The index lost 31 per cent in 2011 and 65 per cent in 2008 compared to losses of 24 per cent and 53 per cent respectively in the Nifty 100. Investors in this fund should therefore be willing to stomach sizeable short-term losses in order to gain from its long-term performance.
![]() Comments
Comments


Comments
Comments have to be in English, and in full sentences. They cannot be abusive or personal. Please abide by our community guidelines for posting your comments.
We have migrated to a new commenting platform. If you are already a registered user of TheHindu Businessline and logged in, you may continue to engage with our articles. If you do not have an account please register and login to post comments. Users can access their older comments by logging into their accounts on Vuukle.