Sensex and Nifty 50 are gaining bullish momentum. The benchmark indices have made a strong close for the week as well as for the month. Both the Sensex and Nifty have closed over 2 per cent for the week.
On the charts, a strong reversal pattern formation is clearly visible. This strengthens the case for the indices to scale new highs in the coming months.
Among the sectors, only the BSE Consumer Durables index has closed marginally lower. Other sectoral indices have closed in green last week. The BSE Realty index outperformed others by surging 5 per cent. This was followed by the BSE Capital Goods index, up 4.45 per cent for the week.
FPIs buy
The foreign portfolio investors (FPIs) were net buyers of Indian equities last week. They pumped in $367 million to the equity segment. The month of April has seen a net inflow of about $1.42 billion.
This is a positive for the equity markets. If the FPIs continue to buy in the coming weeks, then the benchmark indices can see more rally, going forward.
Nifty 50 (18,065)
The support at 17,600 mentioned last week has held very well as expected. The rise to 18,000 has also happened well in line with our expectation.
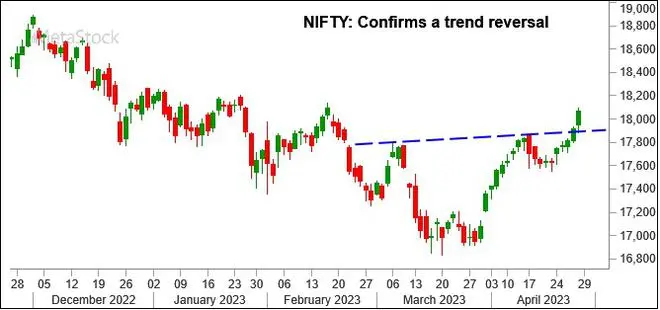
Nifty fell to a low of 17,612.50 on Monday, but then bounced back immediately and sharply. Thereafter, the index continued to rise for the rest of the week. Nifty has closed the week on a strong note at 18,065, up 2.5 per cent.
The week ahead: The outlook is bullish. An inverted head-and-shoulder pattern has been formed on the daily chart. This is a bullish reversal pattern. The neckline support of this pattern is around 17,900. Below that the 100-Day Moving Average (MA) support is around 17,800. So, 17,900-17,800 will be the strong support zone for this week.
Immediate resistance is around 18,200, which can be tested this week. Failure to breach this hurdle can keep the Nifty in a range of 17,800-18,200 for some time. However, eventually the index can break above 18,200. Such a break will take the Nifty up to 18,500-18,700 in the coming weeks.

Graph Source: MetaStock
Medium-term outlook: The inverted head-and-shoulder reversal pattern on the daily chart has strengthened the long-term bullish picture. The target of this pattern is coming around 18,900. An important trendline resistance is at 19,000.
So, as long as the Nifty trades above the support at 17,500, it can rise to 18,900-19,000 over the medium term. That will also keep our long-term bullish view of seeing 20,000-20,500 on the upside intact.
Nifty has to fall below 17,000 the negate the above-mentioned rally to 19,000 and higher levels. But that looks less probable in the absence of any new negative trigger.
Sensex (61,112.44)
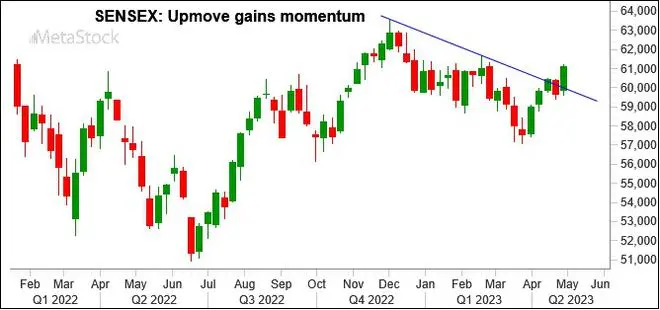
The break above 60,300 and the rise to 61,000 has happened last week. Sensex made a low of 59,620.11 on Monday and then has risen back sharply recovering all the initial loss. The index has closed the week on a strong note at 61,112.44, up 2.44 per cent.
The week ahead: The outlook is bullish. There is an inverted head-and-shoulder pattern visible on the Sensex as well. Immediate support is at 60,850. Below that, the neckline support of the pattern is around 60,500. Moving average cross overs on the daily chart indicates that the downside could be limited. So, a fall below 60,500 is less likely in the near term.
Immediate resistance is at 61,150. A strong break above it can take the Sensex up to 61,700-61,900 in the near term.
Lower support is between 60,000 and 59,500. The short-term outlook will turn negative only on a decisive fall below 59,500. But that looks less probable.

Graph Source: MetaStock
Medium-term view: The big picture is positive. Strong support is around 58,000. Sensex can rally to 63,500-64,000 over the medium term. That will also keep the doors open for the index to target 66,000 over the long term.
This bullish outlook will get negated only if Sensex declines below 58,000. But that looks unlikely as of now.
Nifty Bank (43,233.90)
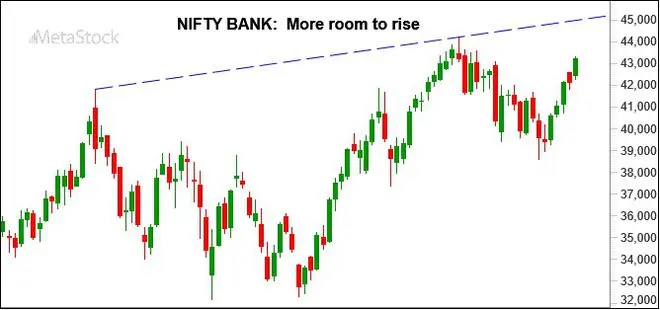
The Nifty Bank index continues to move up. The index rose 2.65 per cent last week. Nifty Bank index has surged over 6 per cent in the month of April and closed on a strong note.
The overall outlook is bullish. Immediate support for this week will be in the 42,800-42,650 region. Below that cluster of supports are poised in between 42,500 and 42,000. So, that will make the 42,000-42,500 a very strong short-term support zone.

Graph Source: MetaStock
As long as the index trades above 42,000, the outlook is bullish. Nifty Bank index can target 44,300 initially and then 45,000 eventually in the coming weeks. That will also strengthen the case for the index to test 48,000 on the upside over the long term.
Dow Jones (34,098.16)
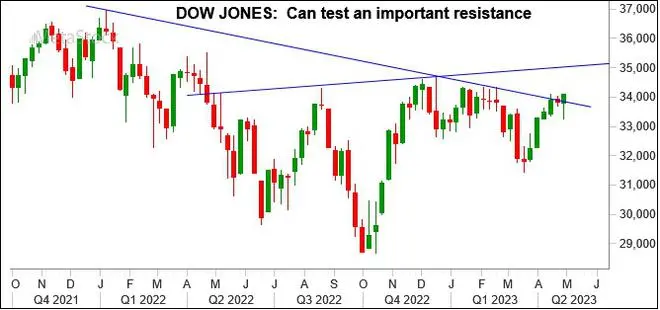
It was a volatile week for the US markets. The Dow Jones Industrial Average fell sharply in the first half of the week. It made a low of 33,235.85. However, the index managed to claw back towards the end of the week. It recovered all the loss and closed higher for the week by 0.86 per cent.
The short-term outlook is bullish. Immediate support is at 33,850. We expect the Dow to sustain above this support and test the immediate resistance at 34,300. A break above 34,300 will the take the index up to 34,700 this week. Such an upmove will leave the doors open for the Dow Jones to target 35,700-36,000 over the medium term.

Graph Source: MetaStock
The near-term outlook will turn negative if the Dow declines below 33,650. In that case, the index can fall back to 33,300 and 33,000. But such a fall looks less probable at the moment.


Comments
Comments have to be in English, and in full sentences. They cannot be abusive or personal. Please abide by our community guidelines for posting your comments.
We have migrated to a new commenting platform. If you are already a registered user of TheHindu Businessline and logged in, you may continue to engage with our articles. If you do not have an account please register and login to post comments. Users can access their older comments by logging into their accounts on Vuukle.