The sell-off in the US equities is weighing on the Indian benchmark indices. The domestic markets opened the week on a positive note. As expected, Nifty 50 broke above 18,000 and Sensex breached 60,500. But they both failed to sustain higher. The US inflation data that was released on Tuesday last week played a spoil sport. The US Core Consumer Price Index (CPI) rising sharply in August by 6.3 per cent (year-on-year) has ignited the speculation in the market for even a 100-basis point (bp) rate hike from the US Federal Reserve this week. The Fed meeting outcome is due on Wednesday.
The data released triggered a sharp fall in the US equity markets and the sell-off extended for the rest of the week. That, in turn, had dragged the Nifty and Sensex lower last week. The weakness in the US equities is likely to keep the Indian benchmark indices also subdued for some time. However, on the charts the Nifty and Sensex are looking relatively better than the Dow. As such, the fall in the domestic market could be limited as compared to that of the US.
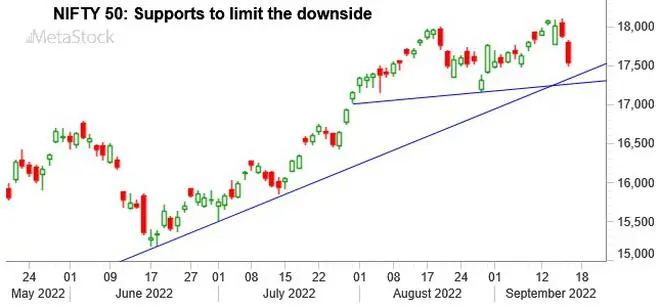
Nifty 50 (17,530.85)
The break above 18,000 happened last week as expected, but it did not sustain. Nifty made a high of 18,096.15 on Thursday and then fell sharply giving back all the gains. Nifty has closed the week at 17,530.85, down 1.7 per cent

Chart Source: MetaStock
The week ahead: The near-term outlook is weak. There is room for the Nifty to decline further from here. A trendline support is available at 17,300. Below that 17,172 – the 55-Week Moving Average (WMA) and 17,150 – a trend line, are the next important supports.
Resistance is at 17,670. As long as the Nifty stays below 17,670, the chances are high for it to test 17,350 and 17,150 on the downside this week.
A higher resistance is at 18,100. Nifty has to breach 18,100 to bring back the bullish sentiment and rise to 18,400-18,500.
For now, we will allow for a fall to 17,300 or 17,150, and then see a bounce back. A sideways range movement between 17,150 and 18,100 is also a possibility that cannot be ruled out in the short term.
Trading strategy: The trailing stop-loss at 17,920 on the long positions recommended last week has been hit. We prefer to stay out of the market this week.
Medium-term outlook: The bigger picture is not looking very weak. The bias remains bullish although a further fall is possible from the current levels.
The level of 16,040 — the 100-WMA — is a crucial support to watch. Only a decisive close below this level will bring back the danger of seeing 15,000-14,500 on the downside. But that looks less likely.
As long as the Nifty stays above the 100-WMA support, the chances are high for it to breach the resistance at 18,100 in the coming weeks. Such a break will pave way for a test of 19,500-19,700 initially and then 20,000-20,200 eventually in the coming months.
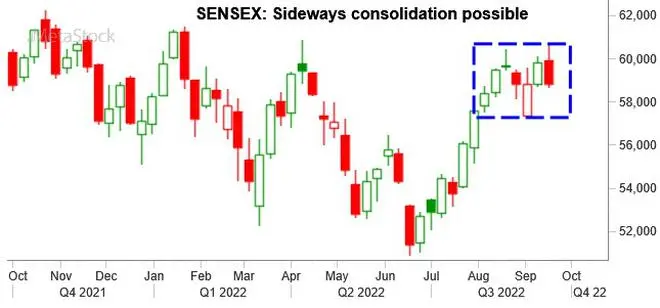
Sensex (58,840.79)
Sensex has come off failing to sustain the break above 60,500 last week. It made a high of 60,676.20 and fell giving back all the gains. The index has closed the week at 58,840.79, down 1.59 per cent.

Chart Source: MetaStock
The week ahead: A further fall is possible this week. Immediate support is at 58,420 – a trendline. Below that, the 55-Week Moving Average (WMA) support is at 57,560 and another trendline support is at 57,345. Sensex can fall to test the above-mentioned supports. However, a fall beyond 57,345 is less likely. In case a break below 57,345 is seen, Sensex can see an extended fall to 56,000 and even 55,000.
Key resistance to watch is at 60,500. Nifty has to break above it decisively to bring back the bullishness of seeing 61,500-61,700 levels on the upside.
The preference is to see a sideways consolidation between 57,350 and 60,500 for a few weeks and then see a bullish breakout above 60,500.
Medium-term outlook: The region between 55,000 and 54,000 is a very strong support. As long as the Sensex trades above 54,000, the bias will remain positive. That will keep the chances high of the index breaking above 60,500 decisively in the coming weeks. Such a break will then pave way for a test of 64,000 on the upside.
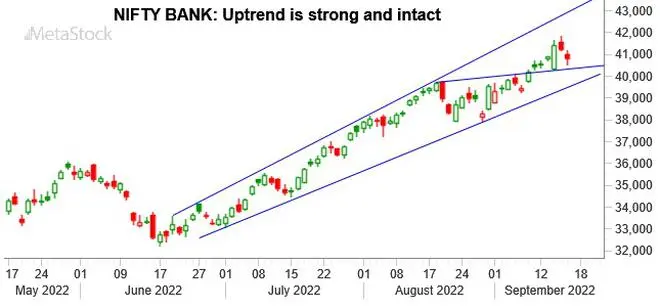
Nifty Bank (40,776.80)
The Nifty Bank index continues to remain strong despite a pull-back seen last week. The index made a high of 41,840.15 and fell sharply giving back some of the gains. It has closed the week 0.89 per cent higher at 40,776.80.

Chart Source: MetaStock
The outlook remains bullish. Immediate support is at 40,350. Below that 40,000, 39,800 and 39,350 are the next important supports. Overall, 40,350-39,350 will make a broad support zone for the index.
The chances are high for the Nifty Bank to sustain above 40,350 or 40,000 itself. As long as the index trades above 39,350, the outlook is bullish to see 42,500 in the coming weeks.
Trading strategy: The trailing stop-loss at 40,600 has been hit on the long positions recommended last week at 40,415.
Traders can initiate fresh long position at 40,450. Accumulate longs at 40,150 and 39,650. The average entry will be at 40,083. Keep the stop-loss at 38,870. Trail the stop-loss up to 41,100 as soon as the index moves up to 41,700. Move the stop-loss further up to 41,850 when the index touches 42,100. Book profits at 42,300.
Global cues
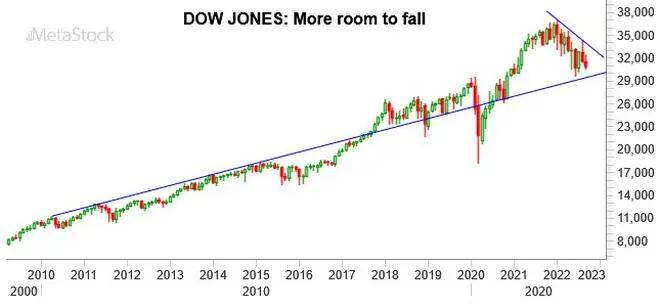
The Dow Jones Industrial Average (30,822.42) was beaten down badly last week. The index tumbled over 4 per cent last week breaking below the key support level of 31,000.
The outlook remains bearish. Resistance is in the 31,300-31,500 region. Higher resistances are at 32,000 and 32,500.

Chart Source: MetaStock
The Dow can fall to 30,000-29,800 in the near term. From a bigger-picture perspective, the Dow has the potential to test 29,500 and even 28,500 on the downside in the worst case. We can expect the current fall in the Dow to find a bottom anywhere in the broad 29,500-28,500 support region. Thereafter, a fresh long-term rally can begin.


Comments
Comments have to be in English, and in full sentences. They cannot be abusive or personal. Please abide by our community guidelines for posting your comments.
We have migrated to a new commenting platform. If you are already a registered user of TheHindu Businessline and logged in, you may continue to engage with our articles. If you do not have an account please register and login to post comments. Users can access their older comments by logging into their accounts on Vuukle.