For a better experience, Read this story in our App
TO ENJOY ADDITIONAL BENEFITS
Connect With Us

Get BusinessLine apps on

Only a couple of years ago, stock-picking would have implied buying a large-cap stock trading at 15 times one-year forward PE from any one of the sectors in an upswing.
In the current environment, the valuations have marched on from the humble 15-16 times and risk-return metrics are not uniform, even for stocks within the same sector. Also, investors are actively seeking opportunities from a broader universe that includes small and mid-cap stocks as well, leading to the regulator expressing concerns of a froth.
Today, following the bull run post-Covid, the framework for stock-picking has undergone a shift. Investors have to reconcile with shifts in valuation, shift from top-down to bottom-up picking as well as variations in risk-return aspects within the same sector.
Here’s more on the shifts and likely implications investors have to take note of, in an evolved marketplace of Indian equities.
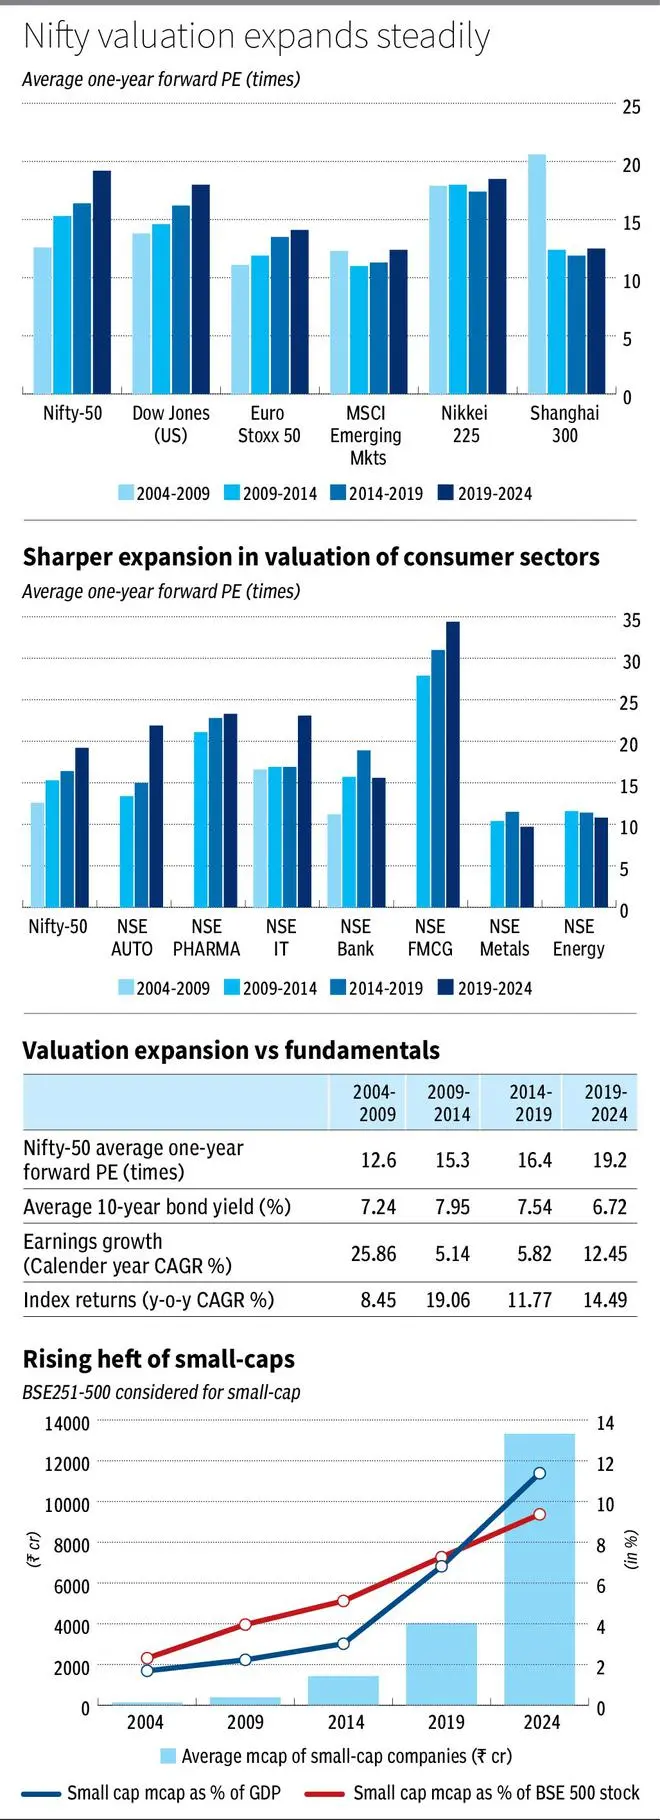
The price of equity as an asset has grown linearly and steadily in the last two decades. Measured as average of last five years’ one-year forward price to earnings ratio, the Nifty-50 PE has risen from 12.6 times in March-2009 to 19.2 times in March 2024. This implies that investors are shelling out more to buy stocks now compared to earlier periods. While earnings growth over the last two decades has risen (2004-09), dropped and stayed flat (2009-2019) and has again looked up in the recent five years (2009-14), the valuations, meanwhile, have steadily increased.
The average bond yields, however, have decreased over the period, albeit marginally, by 52 basis points (see chart). A decline here usually pushes the demand for risk assets, including equities and hence its valuation higher. Net-net, while earnings haven’t shown a linear trend and bond yields too haven’t dropped substantially, the expansion in valuation for the Indian markets has been stronger, implying that expectations have inched up.
The higher valuations have percolated to key sectors as well, but not uniformly. PE multiples (average one-year forward of last five years) in consumer and allied sectors, including auto and FMCG, have expanded (see chart). Banks, in the past five years (2019-24), are trading below the previous five-year average (2014-19). Cyclical industries of energy and metal have remained range-bound.
Globally, Dow Jones has shown a similar trend, going from 13.8 times in 2009 to 18 times in 2024. European index (SX5E) has shown a similar trajectory, but a lower magnitude of expansion. But, MSCI EM index, which represents emerging economies, has been range-bound. China, on the other hand, has settled at a lower 12 times in the last three five-year periods after contracting from 20 times in 2009.
Japan has traded close to 18 times consistently in the past two decades and here, one could attribute a low interest rate regime to the higher equity valuations. As cost of money falls, speculative assets such as equities can experience a higher valuation. The fact that the US and Europe also gravitated towards a zero-interest rate regime in much of the last decade, which coincided with the expansion of PE multiple, reinforces this. However, as interest rates have risen in the last two years in these regions, a reversal in PE expansion can be expected.
.
Investors have to reconcile with the higher valuations as the new normal today, but must keep in mind that there is little room for error at these levels. An equity valuation at 18 times can be justified at a point in time provided the risk-free rate (ie. 10-year G-Sec yields) is 7 per cent and earnings growth rate for risk assets ie equities is 12 per cent y-o-y. (applying the average of last 20 years’ earnings growth).
While the earnings outlook for the next one year suggests an early to mid-teens growth, when we look over longer timeframes, there will be periods of slower earnings growth. A strong credit cycle, as the one India is in the midst of, will lead to rapid capital formation initially and overheating in elongated cycles. Consolidation and correction will follow. This is apart from any global/geo-political risks, which could impact India in future, even though it has shown resilience in the past.
Investors should factor for eventualities in earnings growth slowing down, which implies that valuations could compress.
Small and mid-cap stocks are increasingly being viewed as viable core portfolio options. By applying a little more rigour in research compared to a large-cap investment, investors are willingly turning m-cap agnostic. This approach has opened a plethora of risk/return opportunities focussed on niche markets as investors go beyond the normative approach of the past — ‘a small, small-cap exposure’.
Factors led by increased size of ‘small-cap’ and niche markets they operate in are making for greater faith in the small-cap universe. The small-cap universe is not exactly small anymore. As per AMFI, the small-cap segment today starts from stocks with m-cap of ₹24,000 crore. The average m-cap in this universe is now ₹13,000 crore. The average market capitalisation of BSE stocks ranked 251 to 500 now accounts for 11 per cent of India’s GDP in 2024. In 2004, the same metric stood at a mere 2 per cent. Even within overall BSE-500, the small-cap m-cap (BSE251-500) now accounts for 9 per cent compared to 2 per cent in 2004, pointing to an increasing bottom-heavy focus of investors.
The increased share in GDP, a higher weight in equity markets and a higher absolute size of the companies have clear implications for capital formation, both human and financial. A small-cap company can attract just as much personnel talent as a large-cap can, not only on its payroll but also in the form of investment oversight as well.
For example, this year alone, several small-cap IPOs or even micro-cap (less than ₹3,000 crore m-cap) IPOs have witnessed monetisation by professional investor bodies, including private equity, wealth funds or family offices. Medi Assist, Entero, Jana Small Finance, Capital Small Finance and EPACK are some examples. The much-talked-about unorganised to organised shift seems to be reflected in the management and ownership level of the industries as well. The scale of operations is attracting professional talent addressing the primary concern traditionally attached with the small-cap universe.
Several small and mid-cap stocks are big fish in a small pond, which makes them a large-cap in their own right. They are industry bellwethers in niche spaces, command a significant market share and are able to withstand or pass on industry cyclical pressures just as efficiently as a large-cap company would. For instance, leaders in stationery sales, pharma distribution, clinical laboratories, speciality chemicals with niche portfolios, regional healthcare or small finance banks are some examples. The small size of end market dictates the size of the company rather than being a small player in a large market.
With smaller stocks today becoming an integral part of the portfolio more often than not, investors have to assess and quantify risks in the small-cap universe. “How to mine for small-cap stocks” in bl.portfolio dated March 10, 2023, enumerates the qualitative and quantitative factors to be considered. Leverage, growth and profitability are some of the quantitative factors, while board composition, professional and experienced management, promoter pledging and professional investor shareholding are some of the qualitative factors. Of course, you must also buy it at a reasonable price.
As investible universe has expanded significantly, risk exposure even within a theme is no longer uniform, necessitating a change in strategy. Thus, sector-based diversification is giving way to sub-sector or intra-sectoral allocation strategies.
Consider the larger healthcare sector, for instance. Hospitals are riding on increased penetration and buoyant pricing, labs are shrinking from pricing pressure and pharma is gaining on revival in US generics markets. A healthcare exposure in totality would be exposed to different pressures and most likely result in a sub-optimal overall return. This is found in other major sectors as well.
Consider the cyclicality of large vs mid-cap in IT, dominance in only in one or two areas of lending such as housing, auto, gold or personal credit for lending institutions, focus on conventional or renewable energy among power producers, EV vs ICE engine vehicles in auto and staple vs premium consumption in FMCG. Each sub-segment implies different risk-return exposures within a sector. Investors can no longer stick to sectors from a top-down approach and must investigate further into a sector for the right exposure.
Apart from sub-sectoral outlook, investors are also preferring a thematic outlook. Rather than the vertical design imposed by sectoral investing, thematic investing looks at opportunities from a horizontal view, cutting across sectors. Manufacturing is a theme that aims to benefit from shifts in global supply chains favouring India. This allows picks from autos, chemicals, capital goods, electronics and consumer durables. Recognising this, mutual funds have also come out with products focussing on the same. Consumption, green energy, agriculture, railways and infrastructure-building are emerging themes that, similarly, position investors across sectors.
As market width and breadth expanded significantly, the investor’s job has increased proportionally. A simple top-down approach must be shed and a nuanced bottom-up approach must now be developed. While picking a sector would have sufficed earlier, the current approach would require investors to outline the specific growth driver and a cluster of stocks that are exposed to the theme, to generate adequate risk-adjusted returns.
Published on March 23, 2024

Comments
Comments have to be in English, and in full sentences. They cannot be abusive or personal. Please abide by our community guidelines for posting your comments.
We have migrated to a new commenting platform. If you are already a registered user of TheHindu Businessline and logged in, you may continue to engage with our articles. If you do not have an account please register and login to post comments. Users can access their older comments by logging into their accounts on Vuukle.