For a better experience, Read this story in our App
TO ENJOY ADDITIONAL BENEFITS
Connect With Us

Get BusinessLine apps on

If there is one big event in 2024 that the entire world is looking out for, it is the interest rate cuts in the US. When will the US Federal Reserve begin to cut its interest rates? This is the big question for which the answer remains uncertain till date.
The Fed, in its latest economic forecast release in March this year, has projected its median fund rate to be at 4.6 per cent for 2024. The median fund rate is currently at 5.37 per cent. So, that leaves the door open for a total of 75 basis points (bps) cut in the US interest rates this year. Six more Fed meetings will be held this year.
Market expects the Fed to begin cutting interest rates in June. According to the CME FedWatch Tool, the probability of seeing a rate cut in June is 51 per cent. CME FedWatch Tool gives the likelihood/probability of change in the Fed fund rate and monetary policy.
So, what happens to different asset classes such as equities, bond yields, currencies and gold once the interest rate cut begins? Here is a study based on the past data.
In this study, we see how equities, bond yields, currencies, etc, have moved in the past during the rate cut cycle in the US. We have looked at the US interest rates history from 1986. Since then, there have been four rate cut cycles. Based on technical analysis, we also try to give our projections once the rate cut begins this year.
Our study analyses how the asset classes have performed in two phases. Phase one will assess their performance in the period during which the interest rates in the US were retained at their peak for some time before the rate cuts began. The second phase is how equities, currencies, gold, etc, have performed during the rate cut cycle.
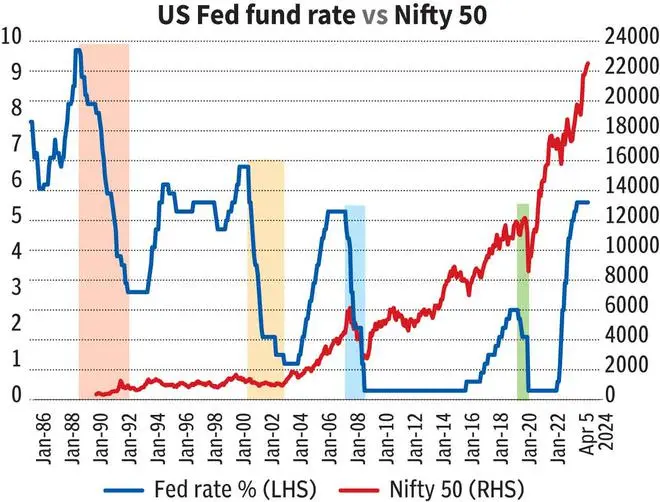
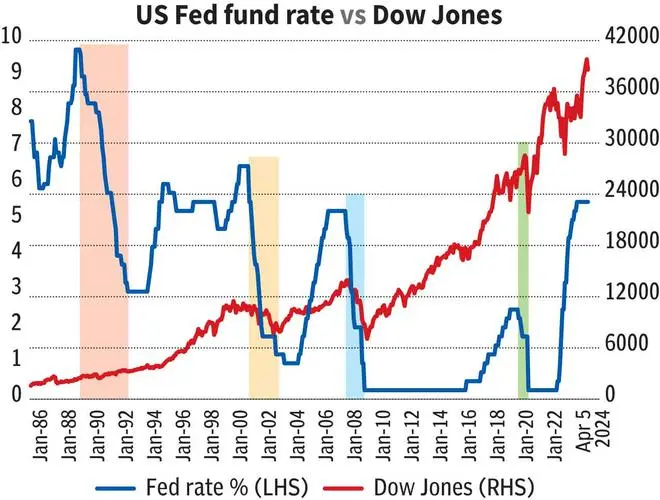
When interest rates were retained at their peaks, equities have gone up all the time. The period between June 2006 and August 2007 was the best among the four rate cut cycles analysed since 1989.
During this time, the Dow Jones rose 20 per cent and the Nifty surged 43 per cent. The year 2000 was an exception for the Nifty where it fell 8.5 per cent.
On the other hand, equities have declined sharply in the rate cut cycle phase. Indeed, Nifty has been beaten down more badly than the Dow Jones in this phase. For instance, from July 2019 to March 2020 when the Fed reduced the rates from 2.25 per cent to 0.25 per cent, the Dow Jones fell about 12 per cent. Nifty, on the other hand, tumbled about 28 per cent.
The period between June 1989 to September 1992 was an exception. Here, when the rates fell from 9.75 per cent to 3 per cent, the Dow Jones surged about 32 per cent. Data available in Bloomberg from July 1990 shows that the Nifty has surged 170 per cent.
Takeaway
History suggests that the equity markets can run into a sell-off possibly in the second half of this year when the Fed begins to cut rates. So, it is more likely that the current rally in the Dow Jones and the Nifty is coming close to their tops. Investors will have to remain cautious.
On the charts
Nifty (22,514) has room to touch 23,650 in this quarter assuming that the rate is retained at this peak of 5.5 per cent till June. Thereafter, when the Fed begins to cut rate, a corrective fall to 21,500-21,000 is possible. If the sell-off worsens, 20,000-19,500 can be seen on downside.
Dow Jones (38,904) can touch 40,800 on the upside from here. After that, we could get a corrective fall to 38,000-37,000.
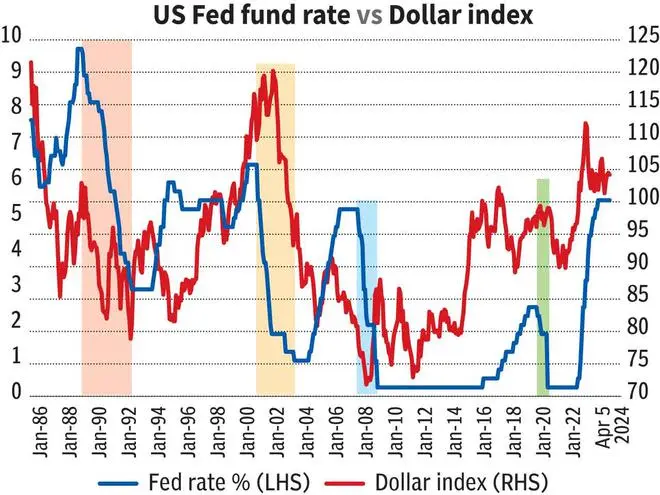
The performance of the dollar index has been mixed in both the phases (ie, interest rates being held at the peak and during the rate cut cycle). So, it will be difficult to take a specific stance on the dollar index once the rate cut begins this time. One specific trend that is visible here is that the extent of weakness is much more than the quantum of strength in the dollar in both the phases. That is, the strength in the dollar index has been subdued to an average of 2 per cent. But, if the dollar declines in any of these two phases, the weakness extended to an average of about 10 per cent.
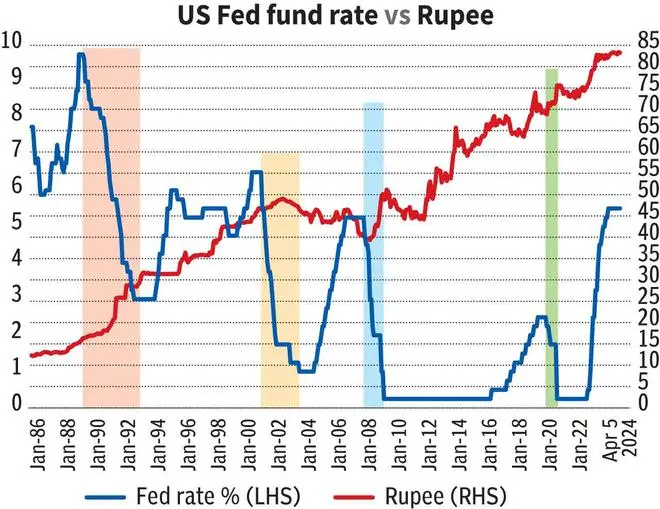
In case of the Indian rupee, it is evident that it has always weakened against the dollar during the rate cut cycle phase. The period of January, 2001 to June, 2003, when the rates were cut from 6.5 per cent to 1 per cent, was an exception. In this period , the rupee gained marginally by 0.4 per cent.
Takeaway
The existing trend in the dollar index can prevail for some time, atleast until the interest rates are retained at the current peak. If the trend reverses after the rate cut begins, then we can see some weakness in the dollar.
Rupee is attempting to weaken gradually over the last few weeks. Looking at history, we can expect the rupee to see more weakness in the second half of this year during the rate cut cycle.
On the charts
The dollar index (104.28) has strong support around 103. It can rise to 106-107. The price action thereafter will need a close watch. Whether the index breaks above 107 or not will determine the next direction of move.
The Indian Rupee (83.30) has been range-bound between 82.50 and 83.50 since September last year. We can expect the rupee to remain below 82.50. If the trend of rupee weakness continues this time also when the Fed begins to cut rates, then we can see the domestic currency weakening towards 85.75-86.25 this year.
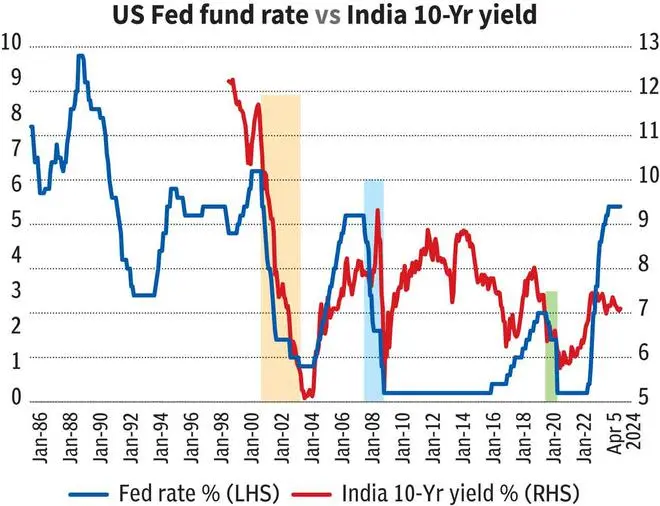
The bond yields, both the US and India, have almost followed the same pattern. The US 10Yr Treasury and India’s 10Yr Government bond yields either peak just before the interest rate in the US peaks or during the time when the rates were retained at the highs.
But, the rate cut cycle phases have been very bad for the bond yields. Both the US and Indian 10Yr bond yields have been knocked down badly during this time. For instance, when the interest rates in the US fell from 5.25 per cent (August 2007) to 0.25 per cent (December 2008), the US 10Yr yield fell from around 4.5 per cent to 2.2 per cent. The Indian 10Yr bond yield tumbled from around 7.94 per cent to 5.26 per cent.
Takeaway
The US and Indian bond yields are likely to drift lower towards the end of this year as the rate cut cycle begins. Although the US 10Yr Treasury yields have been rising recently, the upside could be capped from here as seen from history. The same will be the case with the Indian yields also.
On the charts
The US 10Yr Treasury yield (4.40 per cent) has strong resistance around 4.6 per cent. We can expect it to turn down from there and fall below 4 per cent in the coming months. The downside is open to see 3.8 and even 3.6 per cent.

The Indian 10Yr Government bond yield (7.12 per cent) has room to test 7.2-7.3 per cent. But a rise beyond 7.3 per cent is unlikely. The yield can fall to 6.9-6.8 per cent in the coming months.
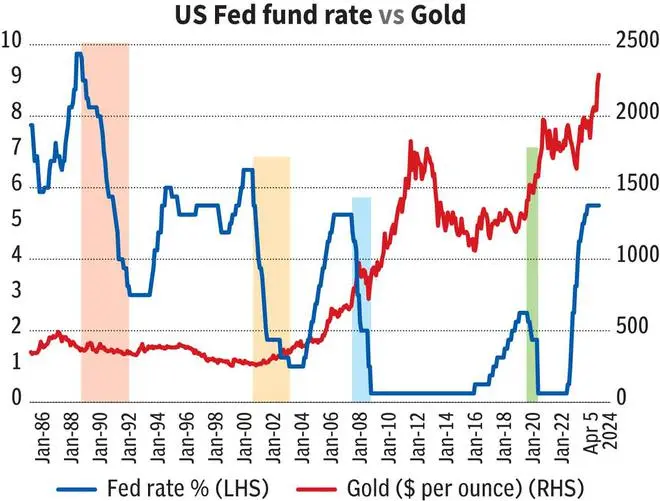
Except in 1989-1992, gold has performed well in both periods of the interest rates being held at the highs and during the rate cut phase. In 1989-1992, gold fell 6.5 per cent when the rates were retained at the peak and 3 per cent during the rate cut phase.
In the other instances, the rate cut cycles have been very good for the yellow metal wherein it has given an average return of 25 per cent.
Takeaway
Gold price has been surging since last month. So, the trend of the yellow metal gaining sheen now at rate peaks and after the rate cuts begin is likely to remain intact this time also. So, we can look for higher gold prices, going forward.
On the charts
Gold ($2,330 per ounce) has strong supports at $2,200 and $2,100. It has potential to target $2,450-2,475 on the upside in the second half of this year. Gold price will come under pressure only if it declines below $2,100. That looks less likely.
A study on the historical Fed Fund rates since 1986 indicates that a crisis in some form has happened after the interest rate cut cycle begins. For instance, in 2000, the interest rates peaked in the US in May at 6.5 per cent. After that, the first rate cut was done in January, 2001. Then in March, 2001, the dotcom bubble burst happened, which lasted till November 2001.
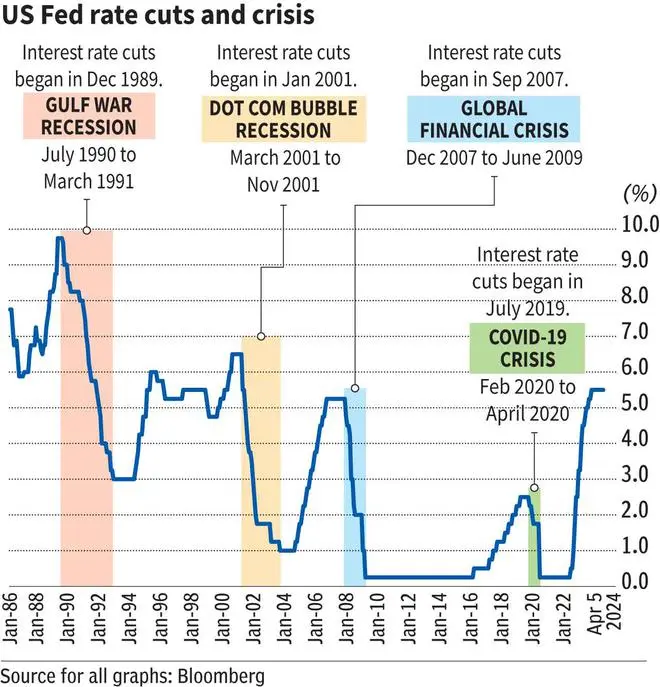
Similarly, interest rates peaked at 5.25 per cent in June, 2006. Thereafter, the first rate cut began in September, 2007. Two months later, the Global Financial Crisis (GFC) hit the markets in December, 2007.
So, are we heading into some kind of crisis like in the past after the Fed starts to cut rates, possibly in June? Past performance is no guarantee of the future. But, what if history repeats itself? So, it’s better to remain cautious.
Published on April 6, 2024

Comments
Comments have to be in English, and in full sentences. They cannot be abusive or personal. Please abide by our community guidelines for posting your comments.
We have migrated to a new commenting platform. If you are already a registered user of TheHindu Businessline and logged in, you may continue to engage with our articles. If you do not have an account please register and login to post comments. Users can access their older comments by logging into their accounts on Vuukle.