

In the ever-evolving landscape of equity markets, with more than 5,000 stocks in BSE, investors face the daunting task of navigating dynamic waters while seeking profitable opportunities. In such a context, a key tool to understand markets/stocks and make informed decisions can be statistical measures. From the foundational arithmetic mean to the nuanced interpretations of stock beta and alpha, statistical tools offer invaluable insights into market behaviour and risk management.
With the immortal words of W. Edwards Deming echoing in our ears, ‘In God we trust; all others must bring data,’ we present here certain statistical measures to help you understand the risk-return assessment of stocks.
Arithmetic Mean
Following each company’s earnings release, analysts tend to revise their estimates, incorporating the latest performance ratios and forward guidance. ‘Consensus estimates’, a term that bl.portfolio readers would have come across in our analyses, is simply the arithmetic mean (commonly referred to as the average) of all the estimates.
Consensus estimates represent a collective forecast of a company’s earnings, aggregating the insights from all equity analysts covering that company. Consequently, when a company’s results align with or surpass these consensus figures, they tend to be interpreted positively by the market. Conversely, falling short of these estimates can elicit a negative market response. Though it can be calculated manually, it is usually referred from a financial database such as Bloomberg, which computes by taking a simple average of broker estimates updated in the last 12 months.
In general, the arithmetic mean can be used both in fundamental and technical analysis of stocks. It provides a snapshot of the central tendency of a set of values, say, valuation metrics such as stock PE. For instance, one would often expect a stock’s PE to generally revert toward its historical average over time, as per the mean reversion theory.
Limitations: However, exercise prudence when interpreting such averages. While the arithmetic mean serves its purpose, it has inherent limitations. Firstly, it treats all data points equally, disregarding potential outliers or skewed observations. For instance, isolated instances of large price spikes can disproportionately influence the average return, distorting the overall perception.
Secondly, while historical performance offers valuable insights, it’s not the sole indicator of future returns. External market dynamics and intrinsic company fundamentals wield significant influence over future trajectories. Alternatives include the geometric mean, which is often used for investment returns as it accounts for compounding effects better than the arithmetic mean. Let’s say your stock price doubled (100 per cent returns) in the first year but lost 50 per cent in the second year. The arithmetic mean of the returns over the two years will give you 25 per cent. In contrast, the geometric mean of the returns (also known as the CAGR) will just be zero!
Standard Deviation
Often, you would have heard market commentary that the stocks trading above 2 sigma levels are potentially overvalued. But what exactly is that sigma? It is a Greek symbol representing standard deviation (SD) which is a vital tool to assess the volatility and relative stability of a stock’s price movements. It quantifies the extent to which a stock’s price tends to deviate from its average closing price. A high SD implies heightened volatility, characterised by frequent fluctuations in stock price, while a low SD signals more stable price behaviour.
By combining the concepts of mean and SD, one can establish thresholds beyond which deviations from the average are deemed significant. Typically, these thresholds are calculated as mean plus (or minus) one SD and mean plus (or minus) two SD.
Over a long period, it is assumed that the distribution of any data, such as stock PE, tends to approach a normal distribution, according to a statistical concept called the Central Limit Theorem. Simply put, the stock PE data will closely resemble a bell curve pattern. For instance, if you were to collect the heights of a large random sample of adult males or females from a given population and plot them on a graph, you would likely observe a bell-shaped curve, with the majority of individuals clustered around the mean height, and progressively fewer individuals of very tall or very short heights as you move away from the mean towards the extremes.
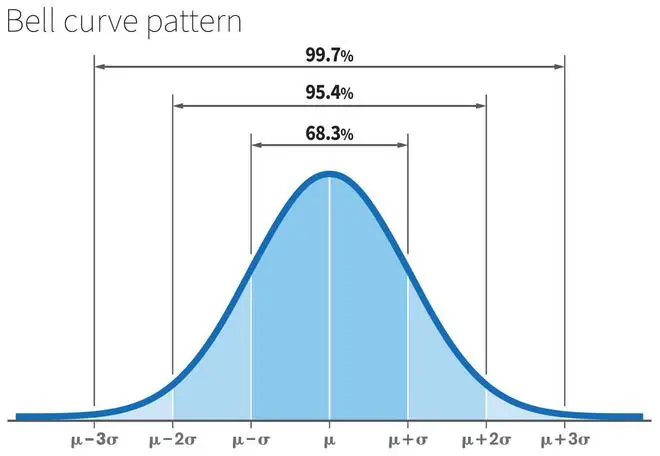
Once this is settled, the three-sigma rule (also called 68-95-99.7 rule) then states that 68 per cent of the data will fall within the first SD from the mean, 95 per cent will fall within two SD, and 99.7 per cent will fall within three SD.
Let’s break it down with an example. Consider Infosys’ Price-to-earnings (PE) ratio over the past two decades. By calculating the mean and SD of this metric and plotting it alongside the threshold bands, we get interesting insights. Notably, instances where Infosys’ PE ratio exceeded the mean plus 2SD, such as in 2006-end and March 2022 as seen in the chart, hinted at potential overvaluation relative to historical norms. Going by the three-sigma rule, we can say that there is a 95 per cent probability that the stock PE will revert below the mean plus 2SD band. Indeed, as evidenced in the case of Infosys, corrections in the stock’s PE ratio have historically materialised following breaches of the mean plus 2SD threshold (see chart).
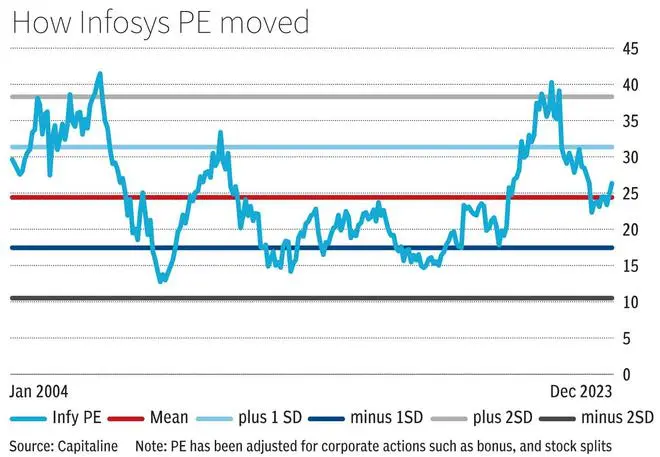
The stock offered a buying opportunity whenever it breached the mean minus 1SD band — in October 2008 and April 2020. Between 2012 and 2020, the stock PE was hovering around the mean and mean minus 1SD band, implying a consolidation phase.
Limitations: However, while the mean plus 2SD threshold band serves as a valuable benchmark to assess stock valuation, it’s imperative to consider a myriad other factors — such as the company’s growth trajectory, the quality of its earnings, industry dynamics, macroeconomic variables, and broader market sentiment. Also, a high P/E ratio alone does not necessarily signify overvaluation. Instead, you should evaluate whether a premium in the stock’s valuation aligns with the company’s future growth prospects and intrinsic value.
Beta
Though SD helps you understand the dispersion of a stock’s returns around its mean return, it lacks a comparative aspect against the broader market, which is where the beta metric comes in. Beta enables investors to assess the systematic risk inherent in a stock. A beta value greater than 1 suggests that the stock tends to be more volatile than the market, implying larger price fluctuations. Conversely, a beta below 1 indicates lower volatility compared to the market/benchmark.
Typically, stocks with higher betas present potential for amplified returns, albeit with heightened risk. Hence, if you have a higher risk appetite, then you might consider such high beta stocks, anticipating greater returns, while those preferring conservative investments may opt for lower beta stocks.
Take the case of Fast-Moving Consumer Goods (FMCG) and Consumer discretionary industries such as automobiles. Hindustan Unilever (HUL), a prominent player in the FMCG sector, typically exhibits a low beta of 0.51 (considering a 20-year weekly period). This low beta can be attributed to the essential nature of its products which fall under the consumer non-discretionary category. Conversely, companies in the consumer discretionary sector, such as Tata Motors, often boast higher betas owing to their sensitivity to economic cycles, consumer sentiment shifts, and commodity price fluctuations. Tata Motors holds a higher beta of 1.35 — evidenced by its 52-week highs and lows of 977.2 and 401.7, respectively.
Moreover, even within the same industry segment, stocks can exhibit varying beta values. Take Maruti Suzuki and Tata Motors, both operating in the automobile sector. Maruti Suzuki has a beta of 0.9, while Tata Motors’s beta is greater than one. These discrepancies can stem from differences in business models, market positions, capital structures, and many other factors. While beta can be manually computed, it is readily available in various financial databases such as Bloomberg (paid) and Refinitiv (paid), stock market analysis websites such as Ticker Tape (paid), and a few brokerage firms, including 5paisa (free).
Limitations: While beta can give you an idea of how a stock moves relative to the market, it’s not a perfect measure because it’s based on past data which may not reflect future performance accurately and doesn’t consider all the factors affecting a stock’s performance.
Alpha
In 2023, amidst a buoyant global market backdrop, the Indian bellwether indices exhibited robust performance, surpassing many of their global counterparts. Despite the overall positive returns witnessed across various stocks, one should understand that mere raw returns do not provide a comprehensive picture considering risk.
Instead, the concept of alpha offers an evaluation of performance which considers the excess return you might get from a stock beyond the market returns. But this does not consider the risk taken to obtain the higher returns and whether the returns are commensurate to the risk. Here, alpha computed using the Capital Asset Pricing Model (CAPM) provides a method to assess a stock’s risk-adjusted returns. This model helps us predict how much return can we expect from an investment based on different factors — such as the risk-free rate (returns from government bonds) and the market risk premium (the extra return you get from investing in stocks compared to safer options). By using CAPM, we can estimate how much return we might get from an investment by multiplying its beta (how volatile it is compared to the overall market) by the market risk premium and adding the risk-free rate.
For instance, in 2023, the India 10-year government bond yielded an average of 7.21 per cent, representing the risk-free rate, while the Nifty 50 index yielded returns of 20 per cent, signifying market returns. Employing CAPM, the expected returns for Infosys, with a beta of 0.66 (considering a 20-year weekly period), were projected at 15.7 per cent. Conversely, Infosys delivered a meagre return of 2.3 per cent during the same period, resulting in a negative alpha of 13.4 per cent.
Limitations: While stock alpha provides insights into a stock’s performance relative to its risk level and the broader market, it has limitations due to its reliance on model assumptions, sensitivity to data quality, short-term focus, susceptibility to market conditions, and limited scope of analysis.
Correlation
Correlation plays a vital role in various aspects of day-to-day life, influencing decision-making, and understanding patterns in different phenomena. In financial markets, it can be exemplified through the analysis of stock prices, where analysis of correlations between assets can add value to investment strategies and portfolio diversification efforts.
Visually, through scatter diagrams, one can see whether the prices of two stocks move in tandem or exhibit contrasting movements. When prices move concurrently, we identify a positive correlation; conversely, if one stock’s price ascends while the other’s declines, a negative correlation is indicated. We infer no correlation between the stocks if the pattern is just random.
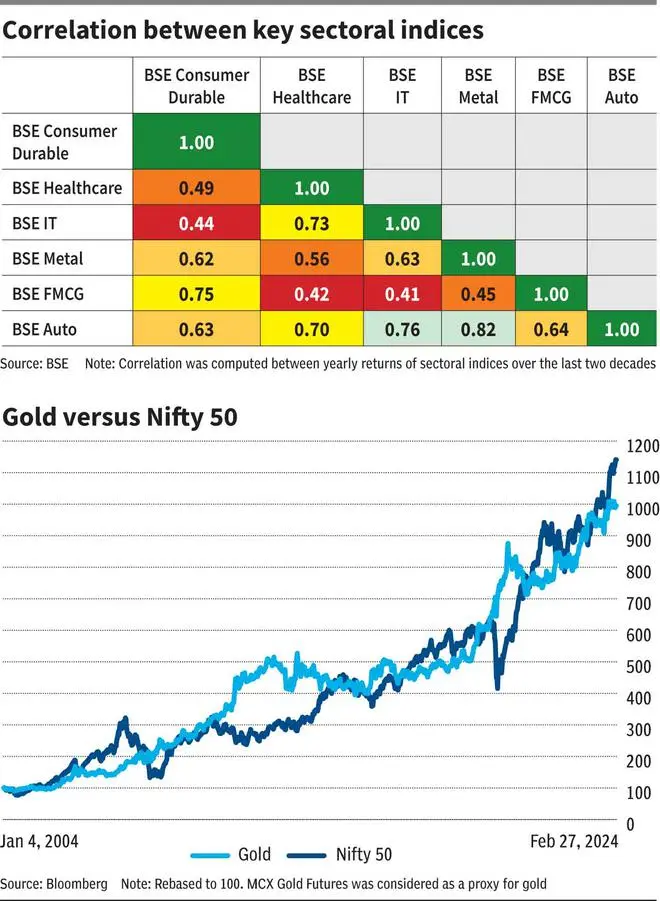
Mathematically, quantifying this correlation entails the calculation of a correlation coefficient, a measure bounded between -1 and +1 that encapsulates the extent of co-movement between the returns of two stocks. For instance, among various BSE sectoral index returns over a two-decade period, the correlation coefficient between the IT and FMCG sectors emerged as the lowest.
The IT sector is often considered cyclical, experiencing periods of rapid growth followed by downturns or consolidation phases, influenced by factors such as, say, the digital boom or the global slowdown. FMCG companies, being providers of essential consumer goods, are less cyclical and are considered defensive investments, with relatively stable demand even during economic downturns. An investor can make use of this opportunity for sector rotation to capitalise on changing market trends or diversify his/her holdings to minimise the overall risk of the stock portfolio.
Beyond individual stocks, correlation also helps you to construct diversified portfolios by assessing the relationship between different asset classes. If we look at the MCX gold future prices and Nifty 50 over the past 20 years, we notice that their prices were inverted between 2011-14 and 2020-22 with the correlation coefficient between their weekly returns being -0.03. Asset classes with low or negative correlations tend to move independently of each other, providing better risk mitigation when combined in a portfolio. Diversification helps reduce overall portfolio volatility and enhances risk-adjusted returns.
Limitations: While correlation can give us insights into how stocks move together, it doesn’t imply causation. In a famous example, researchers found a surprisingly high correlation between butter production in Bangladesh and the movements of the S&P 500 index. Despite there being no logical connection between Bangladesh butter and US stock market performance, the correlation appeared strong over a certain period. This was purely coincidental and didn’t indicate any causal relationship.
![]() Comments
Comments


