

2023 has ended on a very positive note for the global equity markets. The benchmark indices, the Sensex and Nifty 50 had surged 18 per cent and 20 per cent respectively. The Nifty Bank index was up 12 per cent. The mid-cap and small-cap indices clearly outperformed by skyrocketing in 2023. The BSE Midcap and Smallcap indices were up 45.5 per cent and 47.5 per cent.
Among the sectors, the BSE Realty index surged the most in 2023. The index was up 79.5 per cent. This was followed by the BSE Capital Goods and BSE PSU indices which were up 66.9 per cent and 55.3 per cent respectively. The BSE Oil & Gas and the BSE Bankex underperformed last year. They were up 12.8 per cent and 11.2 per cent respectively.
Foreign inflows
The foreign portfolio investors (FPIs) turned net buyers of Indian equities in 2023 after selling heavily in 2022. The equity segment saw a huge inflow of $21.75 billion in 2023. There was a net outflow of $17 billion in 2022. Will the Indian equities continue to attract foreign money in 2024 also? We will have to wait and watch. Continuing flows is a positive for the Indian benchmark indices.
Outlook 2024
Nifty 50 (21,731.40)
Nifty has risen above the key resistance level of 20,500 and has closed on a strong note for 2023. An immediate resistance is at 21,850. Above that, 22,400 and 23,200 are the next important resistances. Considering the recent sharp rise, we can expect the rally to halt either at 21,850 itself or at 22,400 or 23,200. As such, we can expect the Nifty to see a corrective fall from 22,400 or 23,200 towards 21,000 or 20,700 first. In a worst-case scenario, if the index declines below 20,700, then there can be an extended correction towards 19,500-19,300.
The levels of 20,700 and 19,500-19,300 are very strong supports. A fall below 19,300 will not be very easy. So we can expect the Nifty to rise back again either from around 20,700 itself or from the 19,500-19,300 region. That leg of rally will have the potential to take the Nifty up to 24,000-24,500 in 2024.

Chart Source: MetaStock
From a long-term perspective, as long as the Nifty stays above 19,300, a rise to 27,500-28,500 is more likely to be seen. This rise can happen in 2024 itself if the current momentum sustains or in 2025.
Nifty has to decline below 19,300 to become bearish. But for it to break 19,300, a strong and new negative trigger is required. Only then it can break 19,300 and fall to 18,500-18,000. Our preference is to see the Nifty sustaining above 19,300.
Preferred move: Our preferred path of move for the Nifty in 2024 would be to see a test of 22,400 or 23,200 first. Then a corrective fall to 21,000-20,700 or 19,500-19,300 is possible. Thereafter, a fresh leg of rally can take the Nifty up to 24,000-24,500 initially and 27,500-28,500 eventually.
Nifty Bank (48,292.25)
Strong support is now at 47,200. As long as the index stays above this support, the uptrend will remain intact. There is more room to rise from here. Nifty Bank index can rise to 52,000 or 53,100 in the first quarter of 2024. These two levels, 52,000 and 53,100, are important resistances that can halt the current upmove.
We expect the Nifty Bank index to see a corrective fall from 52,000 or 53,100. That can drag the index down to 48,000-47,000. In a worst-case scenario, there could be a steeper correction towards 46,000 as well. However, a fall below 46,000 is less likely. We can expect the Nifty Bank index to resume the broader uptrend anywhere from the 48,000-46,000 support zone. That leg of upmove can take the Nifty Bank index up to 54,000-55,000 in 2024.

Chart Source: MetaStock
From a long-term perspective, 44,000 is a crucial support. As long as the Nifty Bank index trades above this level, it can target 56,000-57,000.
The big picture will turn negative only if the index declines below 44,000. In that case, though less likely a fall to 42,000 and even lower levels can be seen.
Preferred move: A rise to 52,000 or 53,100 first. Then see a corrective fall to 48,000-47,000 or 46,000. After that a new leg of upmove targeting 54,000-55,000 initially and 56,000-57,000 eventually.
Sensex (72,240.26)
Sensex has immediate resistances at 73,200 and 73,600. Above that, the 74,100-74,300 region is slightly higher resistances. We expect either of these resistances to cap the upside for now. A corrective fall from 73,200-73,600 or 74,100-74,300 can drag the Sensex down to 70,000-69,000. In case the fall extends beyond 69,000, then 68,000-67,000 can also be seen on the downside. Thereafter, Sensex can see a fresh rise. That leg of upmove will have the potential to take the Sensex up to 75,000-76,000 this year.

Chart Source: MetaStock
From a long-term perspective, the region between 65,500-65,000 is a very strong support. As long as the Sensex stays above this support, the outlook is bullish to see 82,000 on the upside. If the momentum and the downside during the corrective fall gets limited to 69,000-68,000, then the above-mentioned rise to 82,000 can happen in 2024 itself. Else, that rise will be pushed into the next year.
Preferred move: Test 73,200-73,600 or 74,100-74,300. Then see a corrective fall to 69,000 or 67,000 maximum. After that, a fresh rally targeting 75,000-76,000 initially and then 82,000 eventually.
Dow Jones (37,689.54)
The strong surge and close above the 35,500-36,000 resistance zone in the final quarter of 2023 is a big positive for the Dow Jones Industrial Average. Resistances are at 39,300 and then at 40,200-40,400. The chances are high of the upside to be capped at 39,300 for now. In case a break above 39,300 is seen, then there can be an extended rise to 40,200-40,400.
We expect the Dow Jones to see a corrective fall from 39,300 itself or from the 40,200-40,400 region. That leg of fall can take the index down to 36,800 or 36,000. The 36,000-35,500 region might act as a good resistance-turned-support zone and limit the downside. But if a break below 35,500 happens, then there can be an extended corrective fall up to 35,000-34,000.
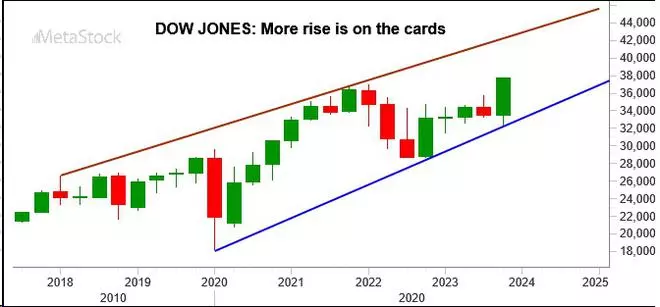
We can expect the Dow Jones to reverse higher again from around 36,000. That can take the Dow Jones higher towards 41,000-41,500 this year.
From a long-term perspective, as long as the index stays above 34,000, there is potential to target 43,500-44,000 on the upside.
Preferred move: Rise to 39,300 and then see a corrective fall to 36,800-36,000. Thereafter, a fresh leg of rally can see the Dow Jones targeting 41,000-41,500 first and then 43,500-44,000 eventually.
![]() Comments
Comments


Comments
Comments have to be in English, and in full sentences. They cannot be abusive or personal. Please abide by our community guidelines for posting your comments.
We have migrated to a new commenting platform. If you are already a registered user of TheHindu Businessline and logged in, you may continue to engage with our articles. If you do not have an account please register and login to post comments. Users can access their older comments by logging into their accounts on Vuukle.