
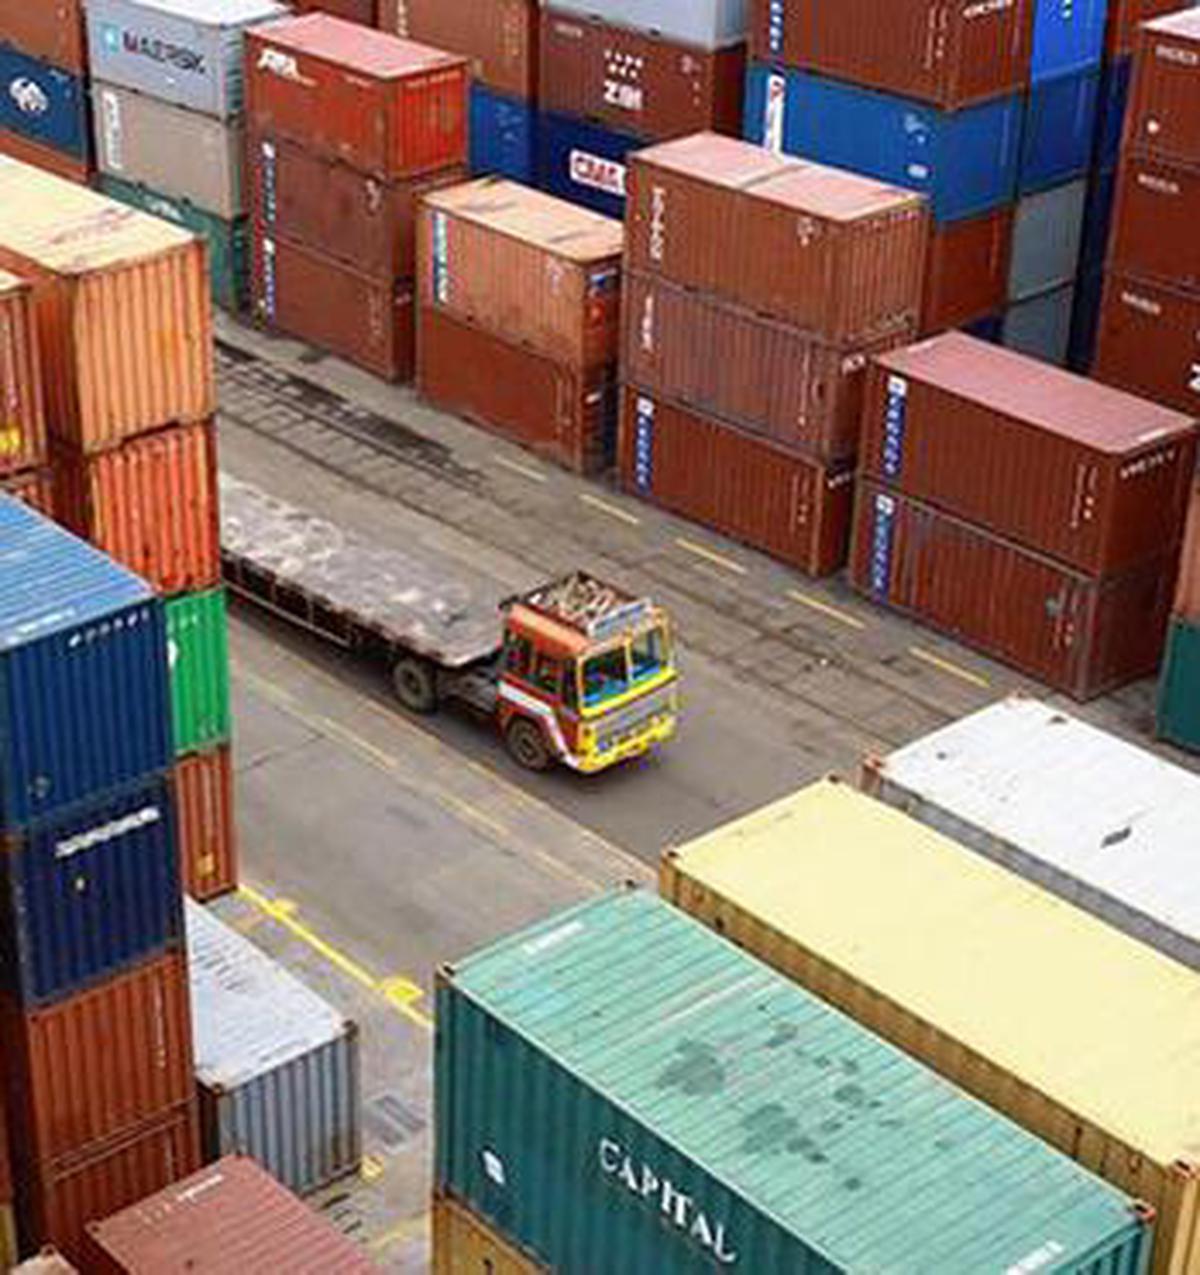
The capital goods sector has been in the spotlight in recent times. The sector has seen tailwinds, such as robust order books, improved execution, and a strong government push. Here are four charts depicting the trends of the Indian capital goods landscape.
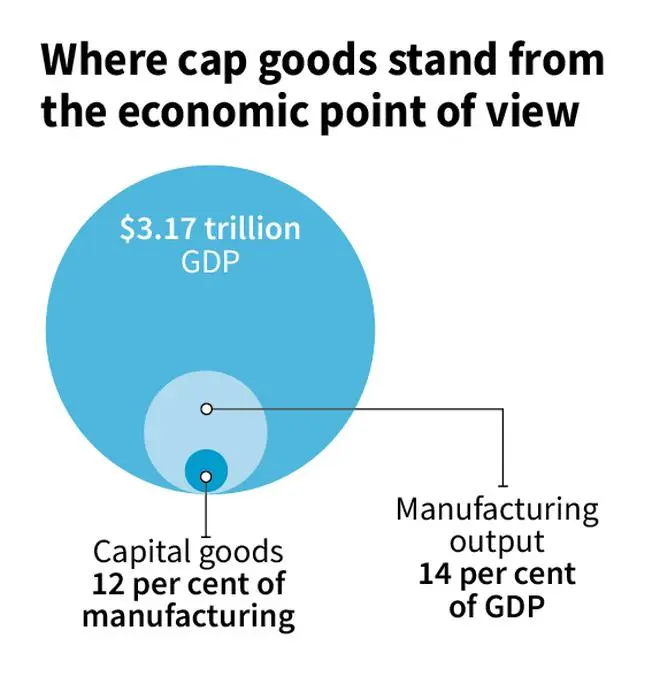
Manufacture in India
India’s manufacturing output forms about 14 per cent of the country’s GDP, while the capital goods comprise nearly 12 per cent of the manufacturing output. Strong policy support and revival in private capex may drive growth for the sector.
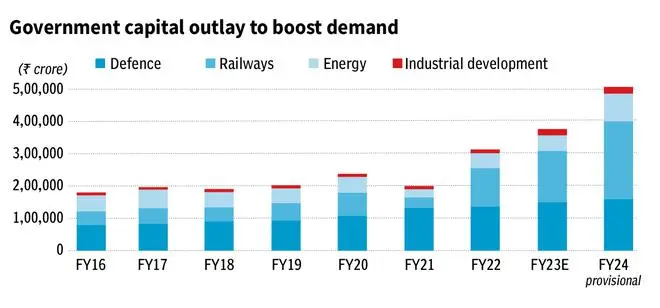
Defence and railways
Defense and railways comprise a major share in the government capital outlay (including both central and state government capex)
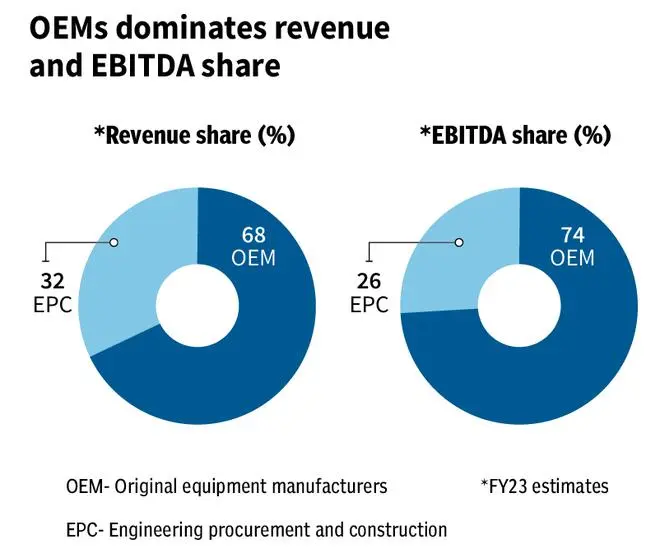
Advantage OEMs
Within capital goods space, OEM cateogory dominates the revenue share while also generating higher EBITDA margins against EPC
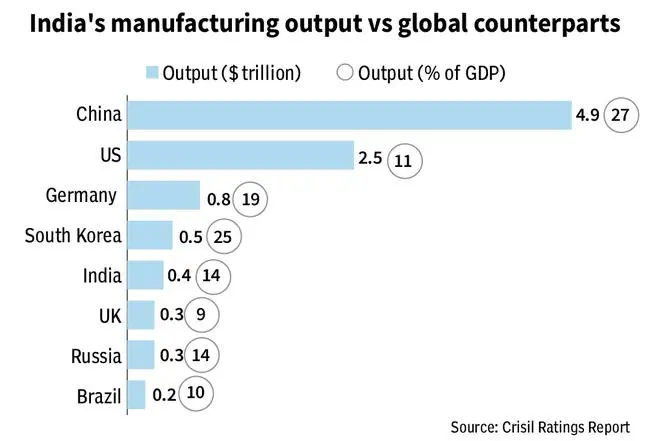
Miles to go globally
While China dominates in terms of manufacturing output, India lags its global peers
![]() Comments
Comments

Comments
Comments have to be in English, and in full sentences. They cannot be abusive or personal. Please abide by our community guidelines for posting your comments.
We have migrated to a new commenting platform. If you are already a registered user of TheHindu Businessline and logged in, you may continue to engage with our articles. If you do not have an account please register and login to post comments. Users can access their older comments by logging into their accounts on Vuukle.