

Those who trade in derivatives would have heard terms such as volatility and VIX. But a lot of people often use these terms interchangeably and incorrectly. So, let’s try to understand these terms.
Volatility
In simple terms, volatility can be thought of as the range of returns for any given underlying. In most cases, it is measured as the standard deviation (or variance) of returns for the same underlying asset. In layman terms, volatility can be thought of as the large price swings an underlying can do around the mean price in any direction (upside or downside). Naturally, the risk associated with investments in an underlying which is highly volatile would be higher as compared to the investments in low-volatile assets. An underlying that moves 8-10 per cent up or down easily in a month would be considered more volatile than an underlying that moves 2-3 per cent. A high-volatile underlying, or a stock can move dramatically, and the return variance could be huge.
What is VIX?
VIX is an abbreviation for volatility index. When we say index in the equity market, we often mean a basket of stocks attached to that index. For example, Nifty 50 index, which is a benchmark index for the Indian market, comprises top-50 stocks by market capitalisation. Similarly, there are several other indices in our markets such as Nifty Bank, Nifty 100, Nifty IT, etc. and globally too like Dow Jones, NASDAQ in the US. However, when it comes to VIX, it doesn’t have any stocks, rather it tells about the market participants’ expectations of the market in the near term. A lot of market participants, traders and investors use VIX levels as a measure of fear and risk present in markets for the near term.
How is VIX calculated?
Chicago Board Options Exchange (CBOE) released CBOE VIX first back in the year 1993. Since then, there have been quite a few updates to the way VIX is calculated. The calculation involved is extensive and is beyond the scope of this article, but for the inquisitive folks, reference is given at the end of the article. However, in a nutshell CBOE VIX is calculated based on the S&P ATM (at-the-money) and OTM (out-of-the-money) options for two near-term expiries with more than 23 and 37 days to expiry. More the demand for OTM options (more so for the put options, when there is fear in the market due to war, inflation, rate hikes, etc.), higher the options premium and consequently higher the VIX will be.
NSE introduced India VIX in 2008 and it is calculated similar to the way CBOE VIX is calculated. It represents the market participant’s anticipated volatility in the near term. It is based on the order book of Nifty options book of near- and next-month contracts. For the India VIX calculation, the bid-ask quotes of near- and next-month NIFTY options contracts for ATM and OTM are considered.
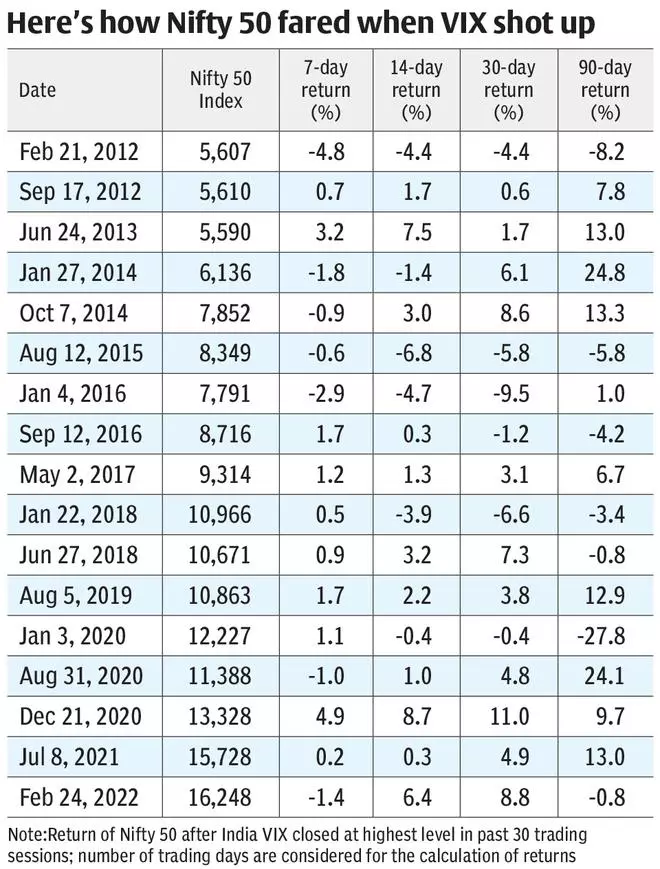
The accompanying table shows an analysis based on VIX and Nifty 50’s returns in the past. It shows what happens when India VIX closes the highest for the past 30 trading sessions (possibly indicating fear in coming days). The data goes back 10 years since the start of 2012. As is evident from this data, the high VIX levels do warrant caution. Investors should note that markets move in cycles. There will be events like the 2008 recession, Covid etc. which will heighten fear and turn the markets bearish for a period of time. But for long-term investors, these events may not matter as markets have a tendency to bounce back in the long run.
(The author is a derivatives market expert)
![]() Comments
Comments


Comments
Comments have to be in English, and in full sentences. They cannot be abusive or personal. Please abide by our community guidelines for posting your comments.
We have migrated to a new commenting platform. If you are already a registered user of TheHindu Businessline and logged in, you may continue to engage with our articles. If you do not have an account please register and login to post comments. Users can access their older comments by logging into their accounts on Vuukle.