The Indian benchmark indices extended their upmove for the second consecutive week. However, the price action on the chart indicates lack of strength. The Dow Jones Industrial Average in the US has also risen well for the second week. Indeed, on the charts, the Dow Jones is looking more bullish and much stronger than the Indian benchmark indices. As such, the chances are looking high for the Dow Jones to outperform the Sensex and Nifty in the coming weeks.
On the domestic front, key resistances are ahead for the Sensex, Nifty 50 and the Nifty Bank indices. So, the price action this week is going to be very important. Whether the indices break their resistances or not will set the trend for the Indian stock markets for the rest of the year.
Among the sectors, the BSE Healthcare index outperformed last week by surging 4.12 per cent. This was followed by the BSE Capital Goods and BSE Metals indices which were up 3.2 per cent and 3.1 per cent respectively.
Sell-off continues
The foreign portfolio investors (FPIs) continued to sell Indian equities for the 10th consecutive week. They sold about $287 million in the past week. For the month of November, the FPIs have pulled out $697 million from the equity segment. FPI sell-off can keep the upside capped in the Sensex and Nifty, going forward.
Nifty 50 (19,425.35)
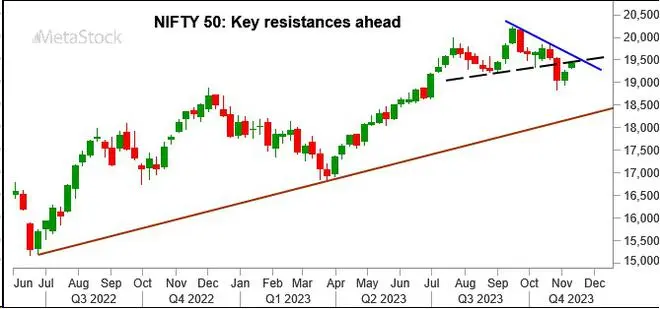
The rise to the 19,400-19,500 resistance region happened last week as expected. Nifty made a high of 19,464.40 before closing the week at 19,425.35. The index was up 1.01 per cent for the week.
Short-term view: Although Nifty has been rising over the last two weeks, it seems to lack strength. Key resistance is in the 19,480-19,500 region and then at 19,550. So the upside can be capped at 19,550. We expect the Nifty to turn down again either from near 19,500 itself or from 19,550. That can drag it down this week initially to 19,300 – an intermediate support. A further break below 19,300 can drag the index down to 19,100-19,200 over the next two-three weeks.
The bearish view will go wrong if Nifty breaks above 19,550 decisively. In that case, Nifty can rise to 19,800-19,850.

Chart Source: MetaStock
Medium-term view: The outlook will remain weak as long as the Nifty trades below 19,550. We retain the bearish view of seeing a fall to 18,300-18,200 or even 18,000 in the coming months.
However, we reiterate that such a fall to 18,300-18,000 will be a very good buying opportunity from a long-term perspective. So, we will have to look at the market from the buy side when Nifty reaches 18,300 and not become overly bearish.
The fall to 18,300-18,000 will get negated only if a break above 19,550 and a rise to 19,800-19,850 happens immediately in the next couple of weeks. In such a scenario, the doors will open for a revisit of 20,000-20,300 levels.
Nifty Bank (43,820.10)
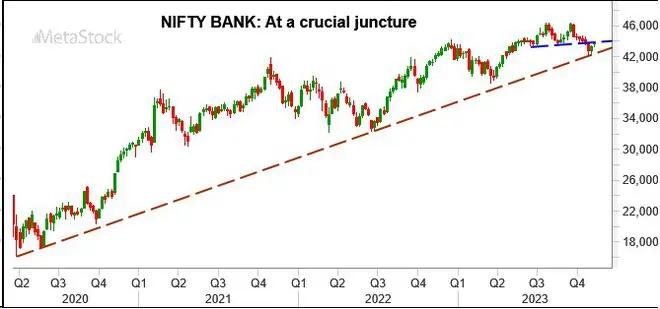
Nifty Bank index has risen well, breaking above the resistance at 43,650. It made a high of 43,908.70 and has come down to close at 43,820.10, up 1.16 per cent.
Short-term view: Immediate resistance is at 44,000. The price action around this resistance will need a close watch this week. Failure to break above 44,000 and a downward reversal will take the Nifty Bank index down to 43,200-43,000 again.
On the other hand, a strong break above 44,000 can take the index up to 44,350-44,500. That will ease the downside pressure. It will keep the chances high for the Nifty Bank index to test 45,000 levels again in the short term.
Considering the double-top pattern on the chart, we prefer the Nifty Bank index to sustain below 44,000 and fall back to 43,000 and lower in the coming weeks.

Chart Source: MetaStock
Medium-term view: The levels of 44,000 and 45,000 are important resistances. As long as the Nifty Bank index trades below 45,000, the medium-term picture will remain weak. That will keep the index vulnerable to break 42,000 and extend the fall to 41,000-40,000 in the coming months.
To negate the bearish view, Nifty Bank index will have to rise past 45,000 decisively. In that case, a rise to 46,000-46,500 can be seen initially. It will also bring back the broader bullish view to see 48,000-48,500 on the upside.
Sensex (64,904.68)
The rise to 65,100 happened last week as expected. Sensex made a high of 65,124 and has come down from there to close at 64,904.68, up 0.84 per cent.
Short-term view: Key resistance is at 65,100 and then in the 65,500-65,600 range. A sustained break above 65,100 can take the Sensex up to 65,500-65,600 this week. However, expect the upside to be capped at 65,600.
Sensex can reverse lower from the 65,500-65,600 resistance zone and fall to 64,700-64,500 initially in the short term. A further break below 64,500 will then drag the Sensex down to 64,000 and even lower eventually.
A decisive rise past 65,600 is needed to negate the above-mentioned fall to 64,500 and lower. Only in that case, the bias will turn positive. Sensex can rise to 66,000 and 67,000 again in that case.

Chart Source: MetaStock
Medium-term view: As long as the Sensex remains below 65,600, the trend will continue to remain down. That will keep alive the danger of a fall to 62,000-61,800 in the coming months.
A break above 65,600 and a subsequent rise past 66,000 will only negate the above-mentioned bearish view. In that case, Sensex can see a strong rise to 68,000.
Dow Jones (34,283.10)
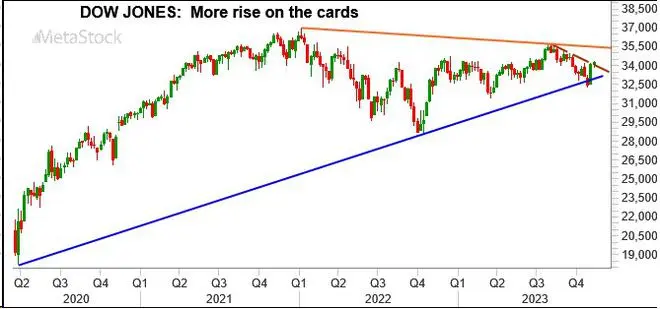
The Dow Jones Industrial Average oscillated in a narrow range around 34,000 for the most part of last week. On Friday, the index surged over a per cent to close the week on a strong note at 34,283.10. The index was up 0.65 per cent for the week.

Chart Source: MetaStock
Outlook: The price action on the chart leaves the bias bullish for the Dow Jones. Strong support is in the 34,000-33,800 region. As long as the Dow trades above 33,800, the outlook is bullish. The index can rise to 34,800-35,000 initially and then to 35,500 eventually in the coming weeks.
The outlook will turn negative only if the Dow Jones declines below 33,800. In that case, the index can fall to 33,500 and even lower. But such a fall below 33,800 looks unlikely at the moment.


Comments
Comments have to be in English, and in full sentences. They cannot be abusive or personal. Please abide by our community guidelines for posting your comments.
We have migrated to a new commenting platform. If you are already a registered user of TheHindu Businessline and logged in, you may continue to engage with our articles. If you do not have an account please register and login to post comments. Users can access their older comments by logging into their accounts on Vuukle.