

At the outset, it is important to note that monetary policy works with a lag of nine months in India. This cannot be overlooked while considering the merit of rate hikes.
With 5.5-6 per cent expected GDP growth in FY 2023-24, headwinds of lower global growth and less than the desired investment rate, it is time to think whether we need a pause on repo rate hike.
Core inflation is sticky and mostly across the board; hence, it is believed that a repo rate raise now may help to manage inflationary expectations. However, it is also true that stickiness in core inflation is supply driven to a great extent. With WPI and PFCE (private final consumption expenditure) deflators falling as they are now, a spillover into CPI is bound to reduce the core CPI number. With rabi crop arrivals, inflation of cereals is likely to come down.
On the contrary, for sustained growth, we need investment. With current average ICOR (incremental capital output ratio) of 5.5 with respect to gross fixed assets (GFA), for a 6 per cent GDP growth, investment should go up to 32 per cent. And this is not happening.
Be that as it may, let us analyse inflation behaviour as well as its measurement, over which there has been some discussion recently. Inflation measured by the All India Consumer Price Index (CPI) started showing an upward trend from December 2019, when it breached the upper limit of the RBI mandated inflation level of 6 per cent, after remaining below that level from September 2014 (except during July 2016). It has remained above 6 per cent since then for 25 out of 40 months.
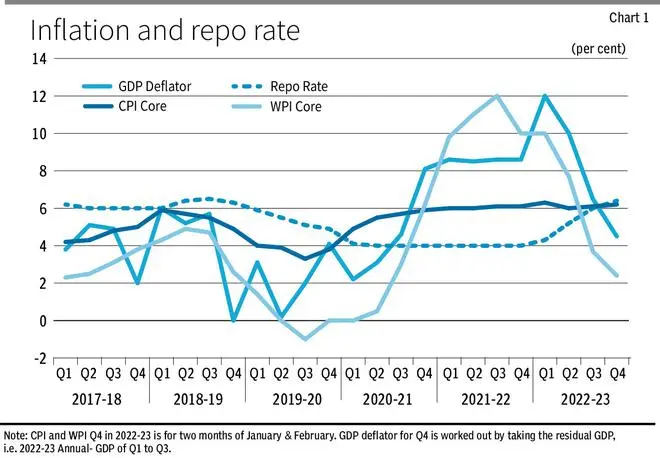
The Reserve Bank of India started increasing the repo rate from May 2022 and cumulatively until February 2023 has raised the rate by 250 basis points. Overall inflation at an aggregate level and inflation excluding food and fuel, have remained sticky and generally above accepted levels. The repo rate remained above the CPI core till Q4 of 2019-20 after which it went below core inflation until Q3 of 2022-23 (Chart 1).
The pandemic and its impact on growth together with global accommodative monetary policy persuaded the MPC to continue an accommodative policy maintaining the repo rate at 4 per cent. It is possible to say that the RBI was behind the curve for a bit longer than warranted.
Three things become clear from Chart 1. First, 2019-20 was the cut-off point from where the regime of benign and moderating inflation came to an end; this holds true across WPI core, CPI core and GDP deflator. Second, GDP deflator and WPI core indicate a very high degree of correlation (0.83) and move in similar direction. Third, CPI core and repo rate have a small negative correlation and move in different directions, except occasionally otherwise.
There is a view that because of a dated base (where commodity weights hardly confirm to the actual consumption pattern) and the methodology of calculation of the aggregate CPI inflation may show a greater deviation from the actuals. The Ecowrap of State Bank of India and RBI in their March monthly bulletin specifically mention these issues. It is true to an extent.
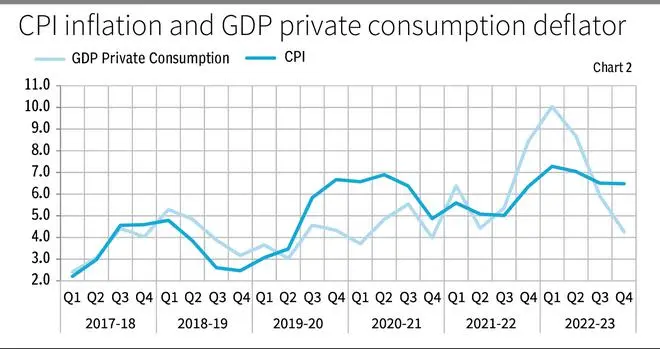
However, if we look at the CPI inflation together with the private final consumption expenditure deflator ( Chart 2), it appears that they are nearly aligned and differences between the two are bi-directional. Compared to the CPI index, which is fixed weight and fixed base (and often similar respondents), the consumption deflator is dynamic and incorporates latest weights. The linearity between the two seems to suggest that base change in itself may not significantly alter the conclusions of stickiness of core inflation.
Range bound
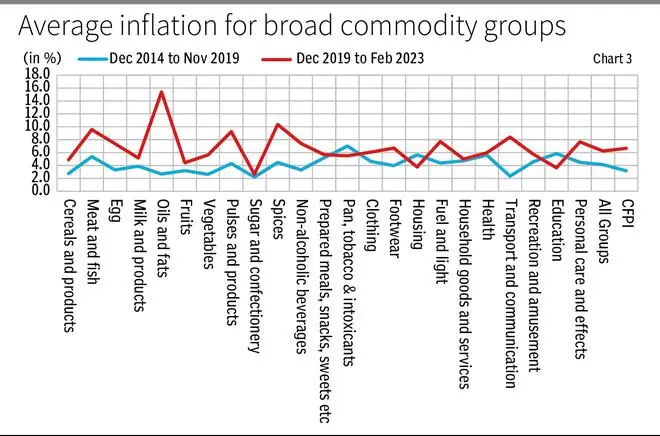
While there have been outliers in terms of commodities and commodity groups, on a medium term basis, inflation has moved in a range during both periods of low and moderating inflation until November 2019 and thereafter it is characterised by sticky inflation. Average inflation during the five years of December 2014 to November 2019 at 4.1 per cent has been close to the RBI mandated rate of 4 per cent. Food inflation during this period at 3.2 per cent has been even lower.
Post November 2019, overall inflation averaged 6.23 per cent, with food inflation reaching an average of 6.67 per cent. Almost all commodity groups, with exception of education, housing and pan, tobacco & intoxicants had inflation in the second period at a level higher than the earlier period. While some items of food, particularly oil & fats and spices showed much higher acceleration in inflation, other products had range bound inflation ( Chart 3).
Hence, an informed analysis of inflation behaviour should precede any policy step. The unemployment figures do suggest growth concerns. With crude inventories building up, crude prices are not expected to go above $90 a barrel. What’s more, a fifth of our crude comes from Russia at concessional rates. Factors suggesting a pause are stacking up.
Gopalan is a former Finance Secretary, and Singhi is a former Senior Economic Adviser, Ministry of Finance
![]() Comments
Comments

Comments
Comments have to be in English, and in full sentences. They cannot be abusive or personal. Please abide by our community guidelines for posting your comments.
We have migrated to a new commenting platform. If you are already a registered user of TheHindu Businessline and logged in, you may continue to engage with our articles. If you do not have an account please register and login to post comments. Users can access their older comments by logging into their accounts on Vuukle.