

The Centre invoked a ban on more than half-a-dozen active agricultural derivative contracts in December 2021. This decision has debarred the commodity exchanges from launching any new contract of the suspended commodity futures for a year from the date of announcement.
There is hardly any conclusive evidence showing a plausible causal relationship between commodity futures (of those which have been suspended since December 2021) and spot price volatility. This article examines the volatility trends in the spot and futures markets over the period from January 2019 until the respective commodity futures are banned.
The source of the data used for the analysis are the National Commodity and Derivatives Exchange (NCDEX) futures prices and NCDEX polled prices for spot. An event study approach is employed to test whether the ban of futures trading resulted in any significant change in the spot price volatility.
Various econometric tests are used to see whether the relationship between spot and futures prices holds in the long run, and explore the possibility of hedging the risk exposure using futures.
Measures and inferences
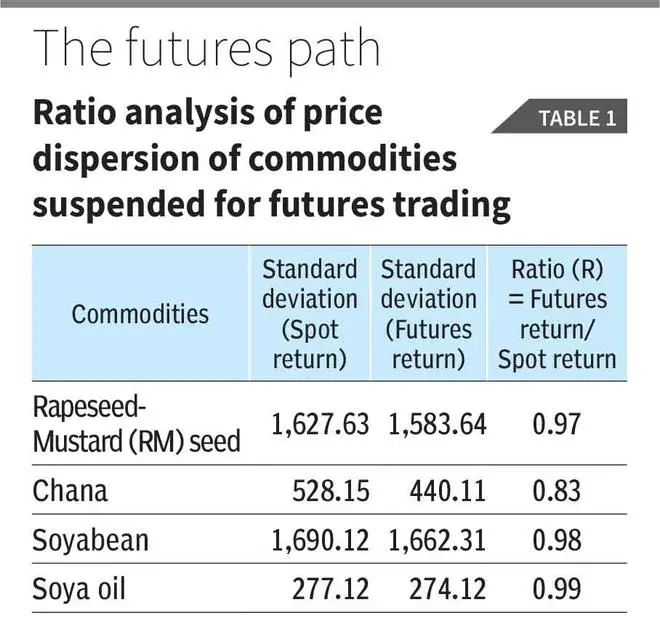
First, standard deviation of the change in spot and futures prices for the banned commodities is determined to see the dispersion of the change in prices (returns) from their historical average returns.
The standard deviation of futures returns is lower than that of the spot returns (Table 1). It indicates that futures contracts of banned commodities could be instrumental in improved price discovery and price risk management.
We maintain a subjective cut-off from 0.80 to 1.10 as lower and upper bound of the ratio (R). It indicates the variability of futures return relative to the spot return. If ‘R’ is greater than one, it points out to speculative activity and when R equals to one, it implies an efficient market that impounds all available information into the price of asset (O’Hara, 1995).
Efficiency factor
It can be seen from the Table 1 that the ratio for soya oil, soybean, and RM seed is close to one signifying the efficiency of futures prices and absence of speculative activities. While in the case of chana, the ratio is 0.83 that indicates the dispersion in futures market relative to dispersion in spot market is least compared with soya oil, soybean, and RM seed.
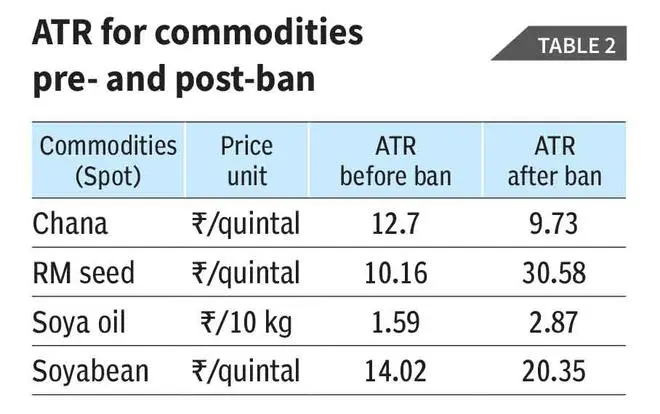
Second, Average True Range (ATR) is an indicator for capturing the price variability or volatility of assets/commodities over a specific period (Table 2).
ATR is a difference between the high and low of the intra-day spot prices for the respective commodities. ATR analysis suggests that the spot price variability or volatility has increased after the futures contracts for these commodities are suspended.
Risk angle
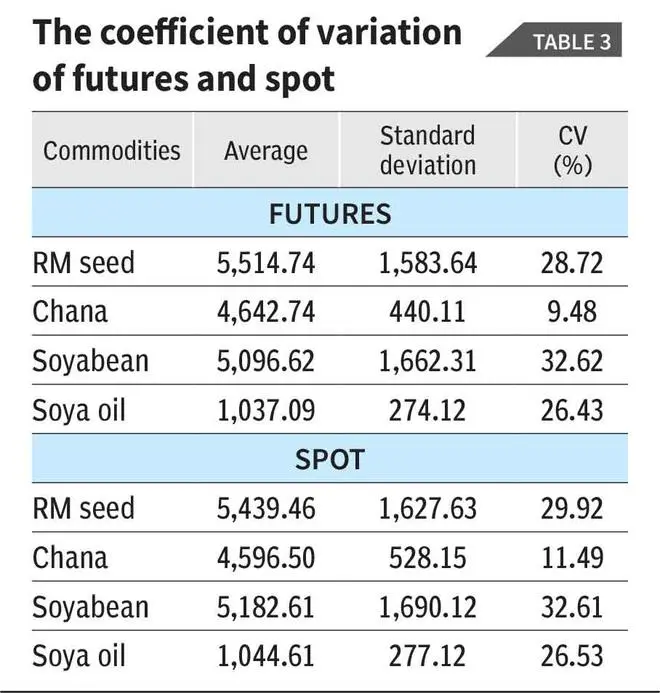
Third, coefficient of variation (CV) measures the dispersion of data around the mean. Ideally, lower the coefficient of variation, the better is risk aversion for investors (Table 3). The estimated CVs of futures of RM seed, chana and soyoil are lower than CVs of RM seed, chana and soyoil in the spot market, whereas CVs of soybean futures is very close to CV of soybean spot indicating that the futures contract is a better platform for trade than a spot market.
Based on the above analyses, a key issue that emerges is that the logic for suspending at least four agricultural futures does not hold. Hence, the government can revisit the decision to revoke the suspension at earliest.
Dey is Chairman of CFAM, IIM Lucknow. Computational assistance of the NCDEX research team is acknowledged. Views are personal
![]() Comments
Comments

Comments
Comments have to be in English, and in full sentences. They cannot be abusive or personal. Please abide by our community guidelines for posting your comments.
We have migrated to a new commenting platform. If you are already a registered user of TheHindu Businessline and logged in, you may continue to engage with our articles. If you do not have an account please register and login to post comments. Users can access their older comments by logging into their accounts on Vuukle.