

Winston Churchill once famously described the intentions of Russia as “a riddle, wrapped in a mystery, inside an enigma”. That was said in 1939 just before the Second World War, but such a description would be quite apt today to describe not the actions of a particular country, but the behaviour of global currency markets in the first half of this year. This is reflected in the surprising pattern of nominal exchange rates since January, which bely many predictions and also contradict several assumptions typically made by economists.
There is no doubt that the year 2022 has already been a roller-coaster, for both advanced economies and low and middle income countries. The Ukraine War added to the disruption of global supply chains that had been significantly upended by the Covid-19 pandemic. Short-term and anticipated supply shortages in fuel, foodgrain and fertiliser as a result of the war had some impact on global trade. The US and EU imposed sanctions on Russia that further complicated and constrained cross-border trade, especially of oil products.
More importantly, these processes led to massive price gouging by major multinationals involved in these trades and an intense period of speculation in commodity futures markets, which led to dramatic increases in these prices.
The consequent inflationary pressures then led central banks in the advanced economies to tighten credit and increase interest rates. This has obviously affected these economies, but has battered emerging markets even more. Finance capital has been moving back to so-called “safe locations” of advanced economies, since even a half percentage point increase in their interest rates is seen as more attractive than staying in emerging and frontier markets, which have lost their all-too-brief allure.
Frantic speculation
As a result, many parts of the world are now experiencing stagflation. But this stagflation has little or nothing to do with the period of the 1970s, to which it has frequently been compared. Rather, it results from a particular — and unique — combination of national economic policies and geopolitical strategies in a few countries, which is having extremely unfortunate impacts in the rest of the world.
However, the “commodity price boom” created by the war seems to be over already, even though the war is still ongoing. This makes it very clear that the war may have been the proximate catalyst but had very little to do with the subsequent price changes. Rather, profiteering and speculation drove the changes. In the futures markets, crude oil prices rose by 37 per cent in the month from $89.13 in February 8 to $124 per barrel in March 8, then fell by 30 per cent in the following month to $94.9, rose again to $122 per barrel on July 6 and then have declined to $88.16 per barrel on August 4 — below the level of early February.
All this was the result of frantic speculative activity, mainly by financial companies that dominated the trades, as we have noted elsewhere. Similarly, in the global wheat futures markets, price have displayed a similar trend of sharp rise and fall. The price of soft red winter wheat rose from $332 per tonne in January to $672 in April, but by June had fallen to $380. These prices are still 50 per cent higher than a year ago, but still short of the crazy peaks observed earlier.
Currency conundrums
These dramatic changes should have been reflected in currency exchange rates. For example, the US sanctions against Russia were designed to bring the Russian economy to its knees by limiting its exports and its access to its own foreign reserves. Yet, currency movements belie such a conclusion.
Consider the evidence presented in Figure 1, which surely contradicts the hopes and predictions of at least the US administration.
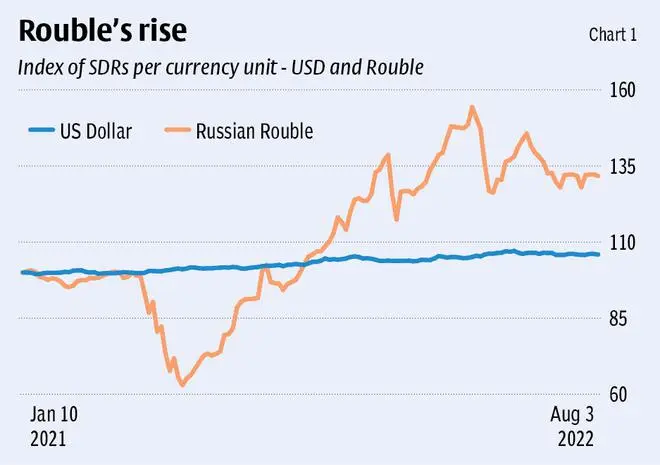
The US dollar has appreciated by around 6 per cent relative to the SDR (which is a basket of five major currencies, and therefore a more stable variable, although 41 per cent of it is determined by the US dollar) since early January 2022, which is probably a result of the monetary policy tightening previously mentioned.
Of course, even this relatively small appreciation has implications for the rest of the world (especially middle and low income countries) since so much of world trade is still denominated in dollars. So the 6 per cent appreciation of the dollar combined with the volatility in oil and grain prices has clearly strained finances and added to domestic price increases for importing countries.
However, the story of the Russian rouble is more interesting. After collapsing by 40 per cent in the initial response to the US-imposed sanctions, it recovered very quickly to reach January levels by early April. Since then, despite some fluctuations, its value in terms of SDRs has strengthened further, so that on August 5 it was 32 per cent higher than it was on January 10.
This resilience probably points to the impact of the oil price rise, which increased the value of its exports, and the intensification of counter-strategies in terms of alternative trading arrangements and domestic import substitution measures.
Stable BRICS
Meanwhile the exchange rates of other BRICS countries, shown in Figure 2, also show an interesting trend since the start of the year. The Chinese RMB and the Indian Rupee have remained broadly stable. However, in the Indian case this is probably due to significant open market intervention by the Reserve Bank of India, which has been running down its external reserves in an effort to support the rupee as foreign portfolio capital leaves the country.
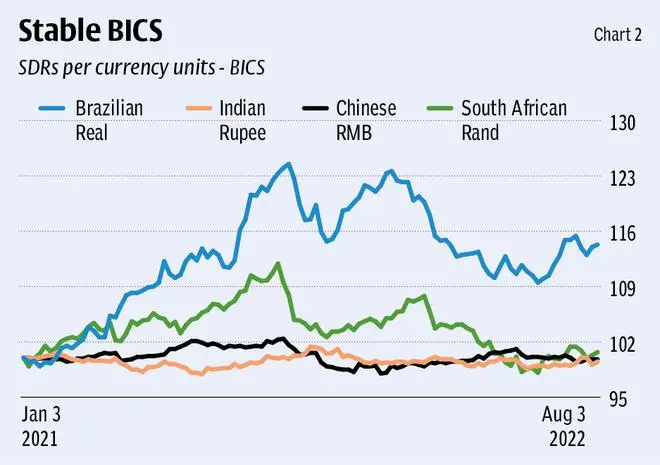
The bigger surprises are Brazil and South Africa, both of which show nominal appreciation vis-à-vis the SDR. In the case of the Brazilian Real, this could reflect the impact to the primary commodity boom, since Brazil is a major exporter of these. The relative decline since late June could suggest some effect of the decline in commodity prices noted earlier, but the exchange rate in early August was still 14 per cent higher than in early January.
The South African Rand also appreciated over the first part of the year, until mid-April, and has since declined in nominal value as the sell-off from emerging markets accelerated, especially in June and July. But it is still at levels similar to the start of the year, that is not showing any significant depreciation.
The ‘crisis’ countries
But what of the weaker and more stressed economies, those currently in the throes of incipient or ongoing economic and financial crises? Some of them are already in explicit default of their external debts; others have already approached the IMF in anticipation of future inability to meet foreign exchange obligations. Figure 3 describes the exchange rate movements in four such countries: Argentina, Bangladesh, Lebanon and Pakistan.
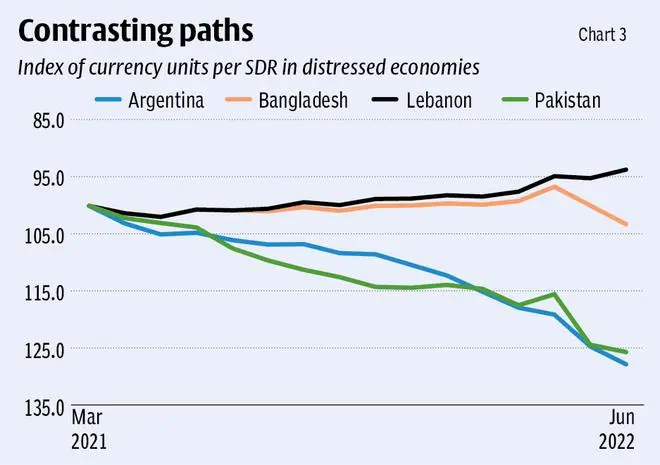
Significant deterioration of the currency in such conditions is the expected outcome. Yet of these four countries, only Argentina and Pakistan show notable currency devaluation with respect to the SDR. In Argentina’s case the peso has declined in value by nearly 14 per cent since the start of the year; for Pakistan, the decline is in the range of 10 per cent. These are substantial but not dramatic devaluations.
By contrast, the Lebanese Pound has actually appreciated in nominal terms by about 4 per cent since January 2022, while the Bangladesh Taka’s value started falling only recently, indicating a 3 per cent decline since the start of the year.
This suggests that the operations of currency markets are much more complex than they are perceived to be. What is clear is that the claim that recent trends show the continued supremacy of the US dollar may be exaggerated.
![]() Comments
Comments

Comments
Comments have to be in English, and in full sentences. They cannot be abusive or personal. Please abide by our community guidelines for posting your comments.
We have migrated to a new commenting platform. If you are already a registered user of TheHindu Businessline and logged in, you may continue to engage with our articles. If you do not have an account please register and login to post comments. Users can access their older comments by logging into their accounts on Vuukle.