

The domestic stock market hit its lifetime peak in mid-October last year, but since then has corrected quite a bit owing to a multitude of factors such as weakening rupee, incessant stock selling by foreigners, interest rate tightening policies and concerns over rising inflation. Be it Nifty 50, Nifty 100 or Nifty 200, benchmark indices are down 13-odd per cent (till July 6, 2022). But did you know that ‘factor’ indices such as Nifty 100 Low Volatility 30 Index and Nifty 50 Equal Weight Index outperformed their plain-vanilla counterparts in this period?
Factor investing is an investment approach that involves targeting specific drivers of return for an asset such as equities. Globally, investment managers — quantitative investors, in particular — have employed ‘factors’ over the years to build and enhance their portfolios. As of March 31, 2022, factor ETFs managed about $1.6-trillion assets globally, a 24.6 per cent CAGR compared with the $178 billion 10 years ago, according to S&P Dow Jones Indices.
Factor investing has some of the features of passive investing, such as being low cost. It also has some of the features of active management by aiming to generate returns above the market-cap weighted index.
At last count in India, there were a total of two dozen index funds, exchange traded funds and fund of funds that use some ‘factor’. Here is a lowdown on these factor-based investment options and their suitability.
Key ‘factors’ used in investing
Today, some of the common factors that have been well documented in academic literature and adopted by the investment industry include low volatility, momentum, quality and value.
Mind you, the factor-investing landscape is evolving in India, with only a dozen products having at least a one-year track record.
Value factor
One of the oldest forms of equity investing, the value approach harks back to the days of Benjamin Graham. Value investing focusses on companies with high intrinsic value, where the stock is selling at a market price below the fair/true value. The premise of all value investing is that stocks with lower valuations tend to generate higher expected returns relative to companies with higher valuations. The existing passively-managed mutual fund products that use ‘value’ factor include Kotak NV 20 ETF, ICICI Pru NV20 ETF and Nippon India Nifty 50 Value 20 Index Fund, with track records of one-six years. Do note the Nifty Value 20 index reflects the performance of a diversified portfolio of 20 value stocks forming part of Nifty 50 index. These stocks are selected on the basis of Return on Capital Employed (ROCE), Price-Earnings (PE), Price to Book Value (PB) and Dividend yield (DY).
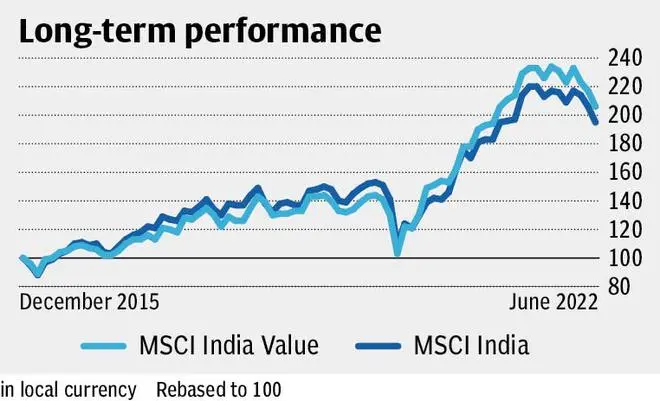
Our view: Though value-oriented portfolios can underperform the market for extended periods, value investing supposedly works well during corrections and in the early stage of rebound. Comparing the MSCI India Value index with MSCI India index, we can see that during the worst months such as March 2020, the value index (down 20.6 per cent) has outperformed the standard index (down 23.4 per cent). In October 2008 when markets fell, MSCI India Value (down 20.17 per cent) outshone MSCI India (down 25.43 per cent) by 500 basis points. Value also does well during early stages of a rebound as we have seen in instances such as December 2008 and April 2020, with 75- and 400-basis point outperformance respectively. However, do note, over longer periods of time, value is yet to prove its edge if you compare absolute returns of MSCI India Value (up 177 per cent) versus MSCI India (up 223 per cent) — the time data series is available from May 2008. Instead of an outright 100 per cent allocation to value, investors should combine growth and value in a mix that suits their risk appetite.
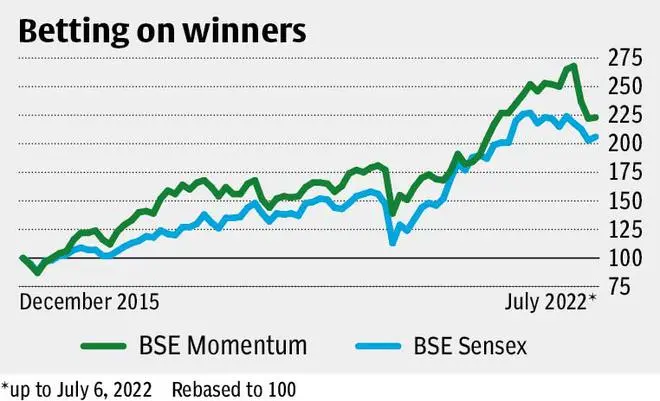
Momentum factor
The momentum factor was first documented in a 1993 research paper ‘Returns to Buying Winners and Selling Losers: Implications for Stock Market Efficiency’. The momentum factor refers to the tendency of winning stocks, usually in six-month and 12-month periods, to continue performing well in the near term. Currently in India, there are three passively-managed momentum-based MF products — Motilal Oswal Nifty 200 Momentum 30 ETF, Motilal Oswal Nifty 200 Momentum 30 Index Fund and UTI Nifty200 Momentum 30 Index Fund. The Nifty200 Momentum 30 index tracks the performance of 30 high-momentum stocks across large- and mid-cap stocks. The Momentum Score for each stock is based on recent six-month and 12-month price return, adjusted for volatility.
Given the momentum bias, the stocks, and by extension the sectors picked up will mostly be the ones that market favours at that point in time. The momentum indices typically have shown the ability to steadily outperform broader indices such as Nifty 50, especially during market rallies. For instance, in 2017 when the Sensex gained nearly 28 per cent, the BSE Momentum index jumped by about 49 per cent. Similarly in 2021 when the Sensex galloped by 22 per cent, the momentum index (up 32.6 per cent) outperformed by 10 percentage points. However, do note the performance takes a hit during corrections, a good example can be so far in 2022, or in flattish phases such as 2018. This is the issue with momentum strategy, as it is not a downside containment approach.
Our view: Any momentum-based index fund or ETF is not suitable for your holding. At best, it can be used in combination with other funds in your portfolio. The churn in momentum-based funds is generally very high compared to broad-based index funds/ETFs. This is because unlike other factors such as quality, value and low volatility, the outperformance from the momentum factor tends to be short-lived. Thus, the strategy may require a constant rebalancing to maintain the momentum exposure, leading to extra turnover cost. Also, momentum as an investment strategy is a high-risk one as it exposes the portfolio to sharper and longer draw-downs.
Low volatility factor
Conventional wisdom would suggest that higher risk would imply higher expected return. However, some researchers found that lower-risk assets tend to outperform higher-risk assets over time in the equity market. And, this is called the low volatility factor. It gained popularity after the 2008 Global Financial Crisis.
In India, currently there are half-a-dozen low volatility factor based passive funds such as Kotak Nifty 100 Low Vol 30 ETF, Motilal Oswal S&P BSE Low Volatility ETF, Motilal Oswal S&P BSE Low Volatility Index Fund, UTI S&P BSE Low Volatility Index Fund, ICICI Pru Nifty Alpha Low Vol 30 ETF and ICICI Pru Nifty Alpha Low Vol 30 ETF FoF. However, most of them have less than two years of track record. Low volatility indices, be it the Nifty 100 Low Volatility 30 index or the S&P BSE Low Volatility index, track the performance of the 30 companies from the underlying basket (Nifty 100 or S&P BSE LargeMidCap) with the lowest volatilities as measured by standard deviation of stock returns.
The low-volatility investment approach seeks to build a portfolio of companies with stable business models that are generally less susceptible to recessions and other macroeconomic events. Volatility of a stock is measured by its standard deviation (SD).
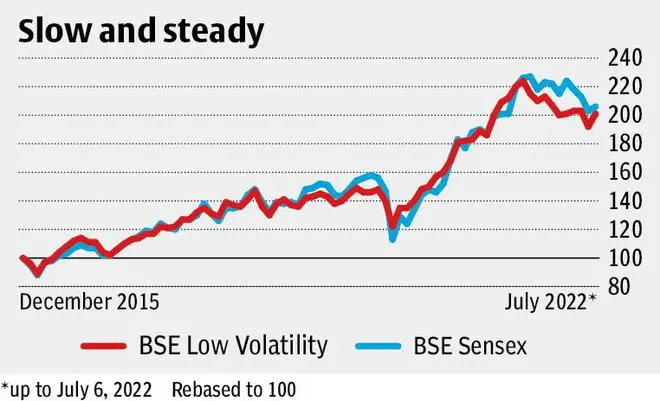
Our view: This strategy tends to perform well in bear markets, thanks to its defensive nature. For instance, in the ongoing correction of 2022, the BSE Low Volatility index has fallen 6 per cent compared to nearly 8 per cent dip in the Sensex. In 2018 when markets were broadly flat, the low volatility factor eked out 100-basis point worth outperformance over the Sensex. This trend also plays out for shorter-period corrections. However, the low volatility approach understandably lags during bull markets. This is a trade-off that investors using the factor have to accept.
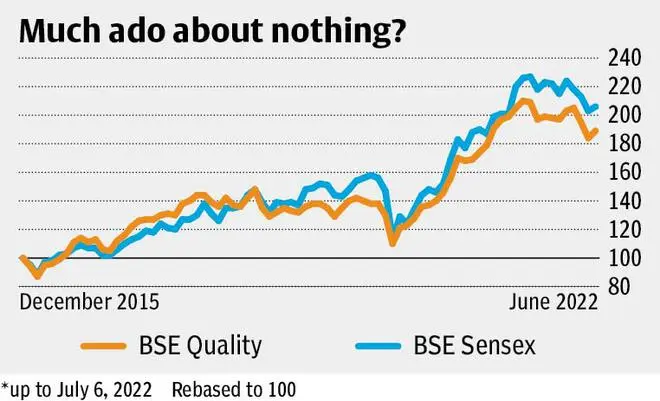
Quality factor
Interest in the quality factor increased in the aftermath of auditing scandals such as the Enron affair in 2001. The quality factor typically considers three essential elements of a company: management efficiency, financial strength and earnings profile stability. But unlike low volatility and momentum, there is a lack of consensus on the definition of the quality factor.
The idea of the quality factor is to identify companies with high profitability, a strong balance sheet and low financial leverage. Those companies that exhibit the quality attribute are understood to manage capital effectively, while still being able to generate robust cash flow in the long run. This is probably why investors tend to pay premium prices for such ‘high-quality’ firms.
Currently, there are a few passively-managed quality factor based funds such as Edelweiss Nifty 100 Quality 30 Index Fund, SBI Nifty 200 Quality 30 ETF, DSP Nifty Midcap 150 Quality 50 ETF and UTI Nifty Midcap 150 Quality 50 Index Fund, available for Indian investors. The existing factor-based funds are built on Nifty 100 Quality 30, Nifty 200 Quality 30 or Nifty Midcap 150 Quality 50 indices. The indices use the parent index (Nifty 100, Nifty 200 or Nifty Midcap 150) as the universe and then track the performance of the top 30/50 stocks selected based on their ‘quality’ scores, which is determined based on return on equity (ROE), financial leverage (Debt/Equity Ratio) and earning (EPS) growth variability analysed during the previous five years.
In recent times, the renewed interest in the quality factor is the possibility of achieving greater diversification given that stock markets witnessed narrow/concentrated rallies.
Our view: Do note that many investors have a healthy degree of scepticism with regard to quality’s status as a standalone factor. When combined with value, quality can enhance gains because one would be betting on clean, good and cheap stocks.
The quality factor is said to come in after a bull market is well established. Assessing performance proves to be difficult in such scenarios because whether a bull market is well established or not is only accurately possible in hindsight.
Equal weight smart beta
An equal-weighted index is where an equal amount of money is invested in the stock of each company that makes up the index. The basket is rebalanced at regular intervals so that each stock allocation goes back to equal weight. This is in stark contrast to any market-cap weighted index where the bigger the market-cap of a stock, the higher its weight becomes.
Currently, there are five MFs using the equal weight smart beta. These are DSP NIFTY 50 Equal Weight ETF, Sundaram Nifty 100 Equal Weight Fund, HDFC NIFTY 100 Equal Weight Index Fund, ABSL Nifty 50 Equal Weight Index Fund and HDFC NIFTY50 Equal Weight Index Fund. Over the long term, say 10 years or more, the CAGR returns of the equal weight indices is better by small margin over market-cap weight indices. But, the story changes in the three- and five-year periods.

Our view: More weight to the historical winner stocks exposes a portfolio to higher risks because stocks/sectors regularly go through rotation and when the largest market-cap stocks in a portfolio underperform, they have an out-sized impact on the overall performance. In contrast, smart beta products based on equal weight indices offer an anti-momentum, forced buy-low-sell-high mode of investing that clearly comes with lower stock and sector concentration risks. Thus, a market-cap-weight based index outperforms during periods of polarisation. But when all stocks have equal weights, such a basket does not have momentum bias and is largely a bet on mean reversion.
![]() Comments
Comments

Comments
Comments have to be in English, and in full sentences. They cannot be abusive or personal. Please abide by our community guidelines for posting your comments.
We have migrated to a new commenting platform. If you are already a registered user of TheHindu Businessline and logged in, you may continue to engage with our articles. If you do not have an account please register and login to post comments. Users can access their older comments by logging into their accounts on Vuukle.