
The volatility in the equity and even the debt markets seen last year seems to be a continuing feature in 2023 as well. From commodity prices skyrocketing and then correcting, high inflation wreaking havoc and pushing central banks around the world to hike interest rates sharply, to developed economies potentially slipping into a recession, the going is tough globally. Add the continuing Russia-Ukraine conflict, China’s Covid woes, and job cuts announced by tech majors globally and start-ups locally, and it becomes clear that investors are not going to have an easy ride.
Even so, we have gold and silver prices rallying sharply in the last couple of months.
If anything, the present time is the best to reinforce the concept of asset allocation. Indeed, spreading your investments across equity, debt and gold may help you ride out volatility, reduce portfolio risks and ensure a better return experience to reach your goals. Silver and REIT (real estate investment trusts) may be other avenues for diversification.
We explain how different asset classes have charted their course over the past 15-plus years, their dynamics, correlation between their movements and how an optimal mix ensures downside protection and reasonable long-term returns.
The trajectories of asset classes
Data taken from calendar year 2006 to 2022 throws up some interesting facets of how equity, debt, gold and silver moved over the years. The Nifty TRI is taken to represent equity, while the CRISIL Short Term Index is taken to gauge debt performance. MCX prices are taken for gold and silver.
In the raging equity markets of 2006 and 2007, we had the Nifty delivering 41.9 per cent and 56.8 per cent, respectively. Debt delivered single-digit returns in those years. Gold prices rallied, but not as spectacularly as equities.
Then the global financial crisis that followed in 2008 saw the Nifty correct by over 51 per cent. But gold prices rallied a spectacular 26.1 per cent that year.
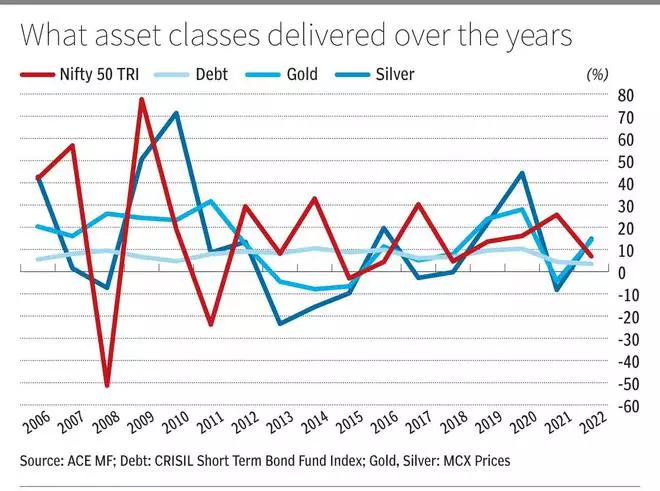
In 2011, we had the Euro Zone crisis and the Indian equity market corrected 23.8 per cent. Gold delivered a spectacular 31.7 per cent returns, while debt managed a little less than 8 per cent. In the Covid-19 year of 2020, gold gave 28 per cent returns, while equities delivered 16.1 per cent returns. In 2021, gold gave negative returns, even as equities continued their strong march.
The point here is that asset classes move in different paths at different points in time. This aspect is relevant for us from the perspective of portfolio construction and diversification. More on that in a bit.
Uncorrelated asset classes
Depending on business and economic cycles, different asset class deliver returns at various points in time. Presently, interest rates are close to their peak in India. Inflation is showing signs of coming under control. India’s macroeconomic parameters are relatively healthy and the country may well grow by at least 6 per cent, when most of the developed markets are likely grow very marginally or even slip into a recession. Select bond categories have become attractive, equities continue to be volatile and gold prices are on the rise.
Even so, timing the entry into any investment avenue or asset class is challenging, making asset allocation critical. When we invest in a portfolio of uncorrelated assets, we achieve two key ends. First, we get a well-diversified portfolio and can benefit from the gains in different asset classes at various points in time. Second, it reduces volatility considerably in returns and insulates the portfolio from the full impact of any serious erosion in value of any one asset class.
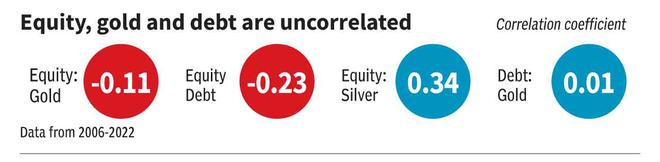
In the table, we have the correlation between different asset classes. The correlation between equity and gold as well as equity and debt are negative. That is, they generally move in opposite directions. Even the correlation between equity and silver is just 0.34, suggesting very low correlation. Fixed income and gold have almost no correlation in each other’s movements. In general, a correlation coefficient of less than 0.3 suggests very little correlation. A value of 0.3-0.5 indicates low correlation between the compared variables.
Mixing investments for optimal returns
One question that may crop up is why not just add fixed income alone for diversification. You must note that an equity-debt portfolio is less diversified and also delivers lower returns than an equity-debt-gold portfolio.
Data from Baroda BNP Paribas AMC throws light on having an optimal mix. Three-year rolling returns from 2002 to 2022 were considered for Nifty 500 TRI, Nifty Composite Debt Index and gold prices. In addition, a 65:35 equity-debt portfolio and a 65:20:15 equity-debt-gold portfolio were considered. The equity-debt portfolio gave more than 10 per cent returns 67.2 per cent of the times, while the equity-debt-gold portfolio delivered more than 10 per cent 71.7 per cent of the times. The average three-year rolling returns over this 20-year period were 14.3 per cent for equity-debt, but 15.4 per cent for the equity-debt-gold portfolio.
The table shows the blended returns that a multi-asset portfolio would have generated over the past 15 years and other timeframes. These are CAGR (compounded annual growth rate) returns. In this case, the Nifty 50 TRI, gold prices and the CRISIL Short Term Bond Fund Index are taken for calculating the blended returns.
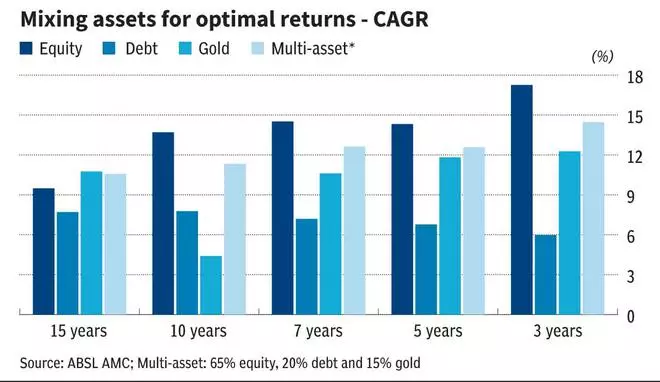
Therefore, a multi-asset portfolio may not deliver the highest return, but it delivers optimal risk-adjusted returns to investors over the long term. And there is also a better chance of your blended portfolio suffering negative returns over periods longer than three years.
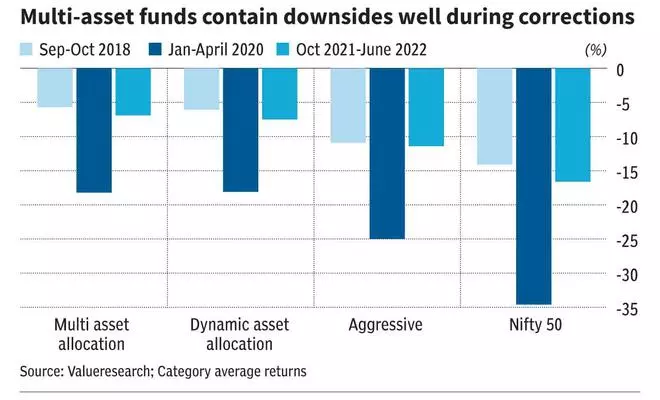
Take the hybrid mutual funds category. In the last five years, it is the multi-asset schemes that have contained downsides better than aggressive hybrid or dynamic asset allocation funds that usually have only an equity-debt mix during periods of Nifty 50’s corrections.
Thus, a multi-asset portfolio is a key for optimal long-term returns.
Deciding the allocation
The asset allocation pattern for your goals must be based on your risk appetite, time horizon and available surplus. As the cliched saying goes, there is no ‘one size fits all’ formula here.
In general, in your younger years, you can have the majority of your portfolio in equity. As you grow older and approach retirement, you must trim equities and up the investments in debt and gold. Some portion of your portfolio must always be in equities even after retirement, so that you get inflation-beating returns.
Although not a tested and rigorous rule, the ‘100 minus your age’ formula to decide the equity allocation in your portfolio would not be a bad point to start off. In general, each asset class plays a role in your portfolio.
Equity: It must be the key portion of your portfolio, simply because it generates the best returns over long-term periods of 7-10 years or more. As an asset class, it is the most suited route for saving towards key financial goals.
Fixed income: Debt provides diversification and is a source of stable returns across timeframes. It is ideal for income generation.
Gold: In general, gold is considered a good hedge against inflation. But as seen earlier and from the table, it becomes clear that gold can be source of returns as well. In fact, for seven years (2006-2012) gold delivered double-digit returns every year. But gold prices are also volatile — from 2013 to 2015, there were three years of decline in prices. You can have around 10 per cent of your portfolio in gold.
Silver: Silver is linked to industrial use — electronics, batteries, smartphones, electric vehicles and solar panels, among others. As digitisation becomes the norm across a host of industries, silver does have the potential to rally, and it indeed has in recent times. Given that its fortune may be linked with economic activity, any weakness may hurt. Also, the key factor to note is that it can have a prolonged bear run compared to gold or even equity markets. From CY2013 to CY2016, silver delivered negative returns. However, data suggests very low correlation to the movement in equity markets for the precious metals. A small portion may be invested in silver ETFs (less than 5 per cent)
Investors can construct an asset allocation pattern with portfolio investments in equity and debt funds, gold ETFs, sovereign gold bonds and silver ETFs.
You can also consider multi-asset allocation mutual funds for getting your investment mix right.
Most multi-asset funds seek to have a 65:20:15 allocation in favour of equity, debt and gold, respectively. This is done to get equity taxation for the investments. Some may also add silver and REITs to the mix. Many funds also take safe derivative strategies to protect equity downsides in the portfolio. As they have very little restriction on the mandate to invest in equity, debt or gold, fund managers are well-placed to take suitable calls.
Based on three-year rolling returns over the past 10 year and consistency in performance, ICICI Prudential Multi-Asset Fund would be a good choice for your investment. This fund is suited for investors with a moderate risk appetite. The fund has delivered 13.6 per cent returns on an average over three-year rolling periods during January 2013-January 2023. Those wanting relatively lower equity exposure but inflation-beating returns can consider HDFC Multi-Asset and SBI Multi Asset Allocation funds.
![]() Comments
Comments

Comments
Comments have to be in English, and in full sentences. They cannot be abusive or personal. Please abide by our community guidelines for posting your comments.
We have migrated to a new commenting platform. If you are already a registered user of TheHindu Businessline and logged in, you may continue to engage with our articles. If you do not have an account please register and login to post comments. Users can access their older comments by logging into their accounts on Vuukle.