It was a sea of red across the global equity markets last week. The Indian benchmark indices, the Sensex and Nifty 50 tumbled over 2.5 per cent each, thereby snapping the strong three-week rally. The Nifty Bank index fell much more about 3.5 per cent last week. The US Federal Reserve indicating that their interest rates would continue to remain higher for a long time caused jitters in the risky assets such as the equities.
While the sentiment is slightly nervous in the markets, key supports are coming up for the benchmark indices near current levels. It is important to see if the Nifty and Sensex are managing to hold above these supports are not. That would set the tone for the equities, going forward. As such, the price action this week will need a very close watch.
FPI action
The foreign portfolio investors (FPIs) continued to sell the Indian equities for the third consecutive week. The equity segment saw an outflow of $648 million last week. For September, the net outflow stands at $1.22 billion. After pouring money into the Indian equities for six consecutive months, the FPIs might turn net sellers for the month of September. This could be negative for the Sensex and Nifty.
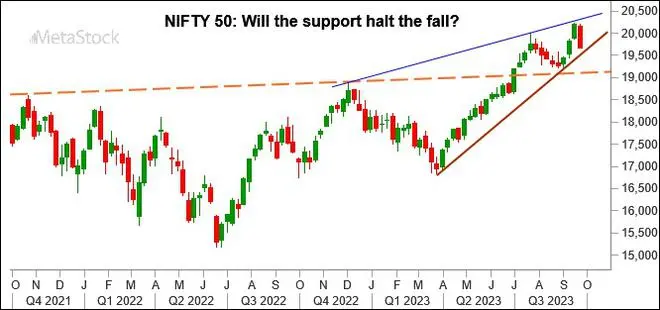
Nifty 50 (19,674.25)
Nifty failed to get a strong follow-through rise above 20,200 last week. The index tumbled below the psychological 20,000-mark and made a low of 19,657.50. It has closed the week at 19,674.25, down 2.57 per cent for week.
Short-term view: Immediate outlook could be little mixed as important supports are coming up. The region between 19,600 and 19,500 is a very good support which can be tested this week. But if the Nifty manages to sustain and bounce back from this support zone, it can ease the downside pressure. In that case, a rise to 19,800 can happen first. A further break above 19,800 will open the doors to revisit 20,000 and 20,200 levels in the short term.
On the other hand, a break below 19,500 can intensify the selling pressure. Such a break can drag the Nifty down to 19,200-19,100. As such the price action around 19,600-19,500 will need a close watch this week.

Chart Source: MetaStock
Medium-term view: For now, the 20,300-20,400 resistance is holding well. This could keep the Nifty in a broad range of 19,000-20,400. As mentioned above, a break below 19,500 will trigger a fall towards 19,000.
However, from a big picture perspective, 19,100-19,000 is a very strong support zone. We expect the Nifty to sustain above 19,000, going forward. That will keep the broader uptrend intact for the Nifty to break 20,400 eventually and rise to 21,500, going forward.
Only a decisive fall below 19,000 will turn the outlook bearish. A strong negative trigger could be needed for that break below 19,000 to happen.
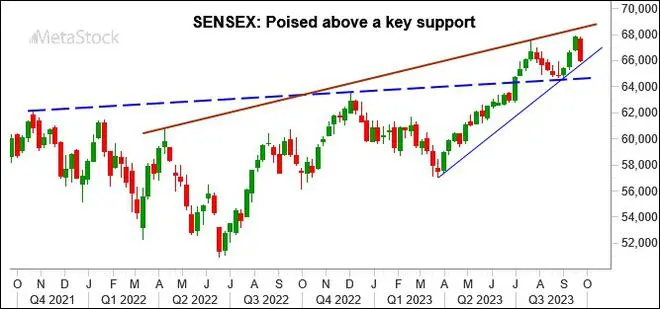
Sensex (66,009.15)
Sensex failed to break above 68,000 and fell below the support at 67,200. That had dragged it towards 66,000 as was mentioned last week. Sensex made a low of 65,952.83 before closing at 66,009.15, down 2.7 per cent for the week.
Short-term view: Immediate support is at 65,800. Whether the Sensex sustains above it or not will decide the short-term outlook. A bounce from this support can take the Sensex up to 67,300 first and then to 68,000 again.
On the other hand, a break below 65,800 will see the current fall extending up to 65,200 this week.

Chart Source: MetaStock
Medium-term view: Though there is room to fall in the short term, the big picture remains bullish. Strong support is around 64,500. Sensex has to fall below this support to turn bearish. Only in that case, a fall to 62,000 and lower will come into the picture.
For now, 64,500-68,000 looks to be the broad trading range. As long as the Sensex remains above 64,500, the medium-term outlook will remain positive. As such, we can expect the Sensex to breach 68,000 eventually and rise to 70,000 and even higher.
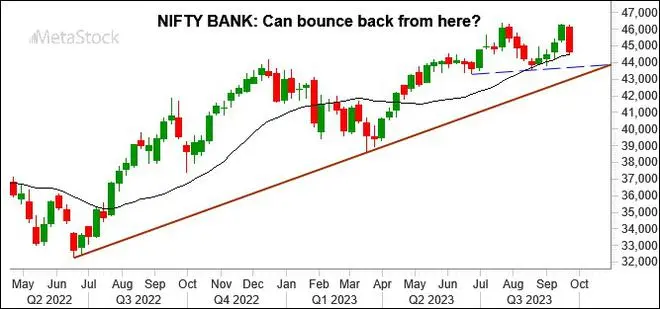
Nifty Bank (44,612.05)
Nifty Bank failed to sustain above 46,000, contrary to our expectation and fell sharply last week. The index has given back almost all the gains made in the previous two weeks. This could delay the rise to 48,000 that we had mentioned last week. The index has closed at 44,612.05, down 3.5 per cent.
Short-term view: An immediate support is at 44,450 – the 21-Week Moving Average (MA). This MA has given strong support from mid-August to early-September this year. So, the chances are high for this support to limit the downside this week. A bounce from around 44,450 can take the Nifty Bank index up to 46,000-46,200 again. That will bring back the earlier bullishness into the market again.
But if the index declines below 44,450, it can come under more selling pressure. In that case, the Nifty Bank index can fall to 43,750 and even 43,300 in the short term.

Chart Source: MetaStock
Medium-term view: Strong support is around 43,000. As long as the Nifty Bank index remains above 43,000, there is no change in the bullish view of seeing 48,650-48,700 on the upside.
The outlook will turn bearish only if the index declines below 43,000. In that case, a fall to 42,000 and lower levels can be seen.

Chart Source: MetaStock
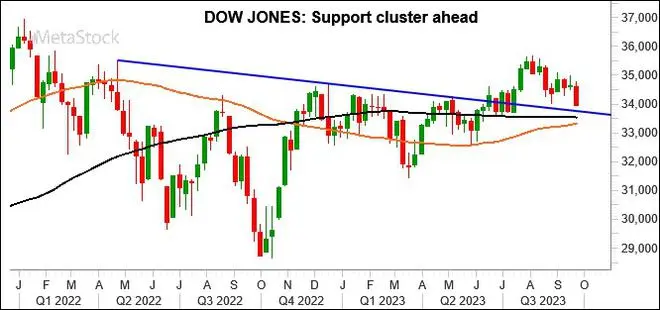
Dow Jones (33,963.84)
Contrary to our expectation, the Dow Jones Industrial average fell breaking below the support at 34,200. Although the index rose immediately after the Fed meeting outcome, it could not sustain. The index fell sharply during the press conference and sustained for the rest of the week. The Dow made a low of 33,947.34 on Friday before closing at 33,963.84, down 1.89 per cent for the week.
Outlook
The short-term outlook is weak. The index can fall more. Key supports to watch are at 33,700, 33,500 and 33,300. We can expect the Dow Jones to bounce back again from either of these three supports. Such a bounce can take it back up 34,600-34,800, going forward.
As long as the Dow Jones stays above 33,300, the bigger picture will continue to remain bullish and the rise to 36,000 will remain alive. Only a strong break of 33,300 and a subsequent fall below 33,000 will turn the broader outlook bearish. In that case, the Dow Jones can fall to 32,500 and lower. But for now, we see less possibility for this fall to happen.


Comments
Comments have to be in English, and in full sentences. They cannot be abusive or personal. Please abide by our community guidelines for posting your comments.
We have migrated to a new commenting platform. If you are already a registered user of TheHindu Businessline and logged in, you may continue to engage with our articles. If you do not have an account please register and login to post comments. Users can access their older comments by logging into their accounts on Vuukle.