Equity markets witnessed a strong bounce last week. A sharp fall in the US Treasury yields aided the rise in the global stock markets, especially in the US. The Dow Jones Industrial Average in the US surged 5 per cent last week and recovered the loss made in the previous two weeks. The Indian benchmark indices, the Sensex and Nifty 50, were up about a per cent each. Nifty Bank Index rose 1.25 per cent.
Among the sectors, the BSE Realty index surged over 10 per cent last week. The BSE Auto index, down 0.71 per cent, was the only sectoral index that closed in red last week.
Last week’s rise has given some breather to the markets. It is now important to see if there is a strong follow-through rise from here. Also, key resistances are coming up for the Indian benchmark indices which can halt the current rise. For now, we see this upmove as just a corrective bounce within the ongoing downtrend. As such, we expect the upcoming resistances to cap the upside in the Indian benchmark indices.
More selling
The foreign portfolio investors (FPIs) are on a selling spree. The FPI were net sellers of Indian equities for the nineth consecutive weeks. Last week, they sold $913 million. The month of October saw a net outflow of $2.95 billion. The FPIs have sold about $4.7 billion in the equities over the last couple of months. As long as the FPI selling continues, the Sensex and Nifty 50 are unlikely to see a strong rise.
Nifty 50 (19,230.60)
Nifty fell to a low of 18,973.70 initially, but then managed to recover sharply from there. It has closed the week at 19,230.60, up 0.96 per cent.
Short-term view: There is room for further rise from here. Immediate support is around 19,100. If the Nifty sustains above this support, it can rise to 19,400-19,500 this week.
This 19,400-19,500 is a strong resistance which can cap the upside. We expect the Nifty to reverse lower again from this 19,400-19,500 resistance zone. Such a reversal can drag it down to 19,200-19,100 initially. A further break below 19,100 can take the Nifty down to 18,800-18,700 in the short term.
A decisive rise past 19,500 is needed to negate the bearish view mentioned above. If that happens, though less likely, Nifty can revisit 19,800-20,000 levels and turn the outlook positive again.
Our preference is to see the Nifty staying below 19,500 and fall to 18,800-18,700 in the short term.

Chart Source: MetaStock
Medium-term view: The outlook will remain bearish as long as the Nifty stays below 19,500. The expected fall from around 19,500 will have the potential to drag the Nifty down to 18,200-18,100 over the medium term. Thereafter, a fresh leg of upmove can begin.
From a long-term perspective, the fall to 18,200-18,100 will be a very good buying opportunity.
Nifty Bank (43,318.25)
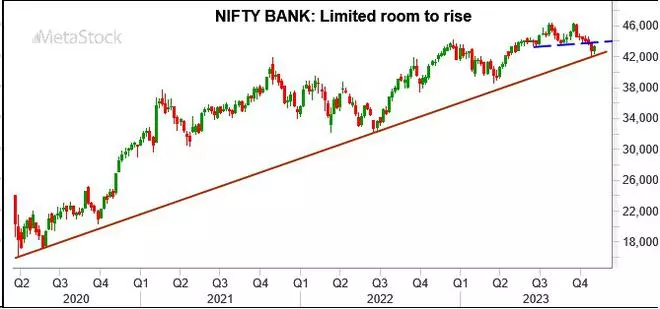
Nifty Bank index made some recovery after having fallen for six consecutive weeks. The index managed to sustain well above 42,000 and rose last week. It has closed at 43,318.25, up 1.25 per cent.
Short-term view: The bounce last week is very significant. It has happened from around the key trendline support level of 42,000. However, the price action last week is not showing momentum. So, there is a danger of a downward reversal.
Immediate resistance is at 43,500 and 43,650. Above that, 44,000 is the next important resistance. Although a rise to test 44,000 cannot be ruled out, Nifty Bank index has to surpass this hurdle to become bullish. Only in that case, the upmove can gain momentum and take the index up to 44,500-45,000 and higher levels.
A downward reversal from either around 43,650 itself or 44,000 will take the Nifty Bank index down to 42,500 and even 42,000 again.
Looking at the price action on the chart, the trend is down. As such, we prefer the index to stay below 44,000 and fall back to 42,000 in the coming weeks.

Chart Source: MetaStock
Medium-term view: The outlook will remain bearish as long as the Nifty Bank index stays below 44,000. A double-top bearish reversal pattern on the chart strengthens the bearish case. That will keep the index vulnerable to break below 42,000 going forward and fall to 40,500-40,000 in the coming months. Thereafter, a fresh leg of rally can begin.
A strong break above 44,000 is needed to turn the sentiment positive and take the index up to 45,000-46,000 levels again. But that looks unlikely at the moment.
Sensex (64,363.78)
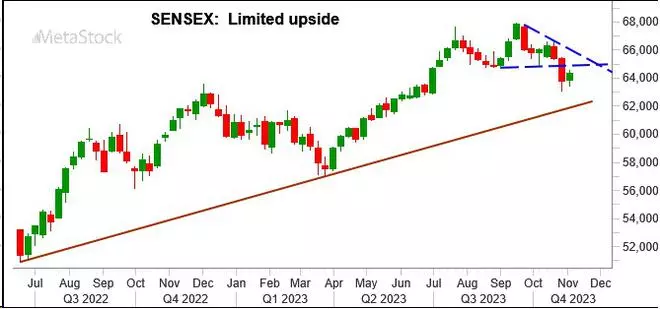
The corrective bounce to 64,500 mentioned last week has happened. Sensex touched a high of 64,535.19 before closing the week at 64,363.78, up 0.91 per cent.
Short-term view: There is some more room left on the upside for the Sensex to rise. Resistances at 64,850 and 65,100 can be tested this week. But thereafter we can expect the Sensex to reverse lower again and fall back to 63,500-63,000 again. In case Sensex manages to breach 65,100, an extended rise to 65,500-65,600 can be seen.

Chart Source: MetaStock
Medium-term view: The outlook is negative. The broad region of 65,600-66,000 is a very strong resistance. A strong rise past 66,000 is needed to turn the outlook positive for a rise to 68,000 levels again.
As long as the Sensex trades below 66,000, the chances are high for it to fall to 62,000-61,800 over the medium term. Thereafter, a fresh leg of rally can begin.
Dow Jones (34,061.32)
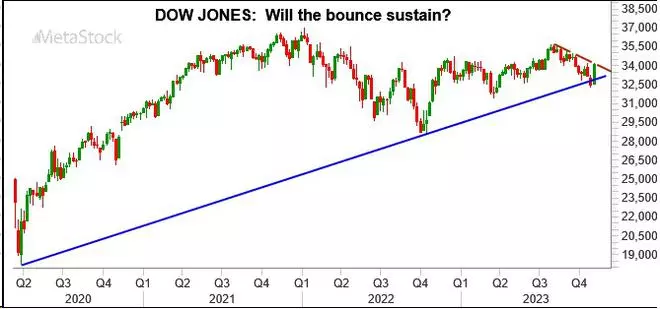
The fall to 32,000-31,800 that we had expected last week did not happen. On the contrary, the Dow Jones Industrial Average surged above 33,000. The index has closed on a strong note at 34,061.32, up 5.07 per cent last week.

Chart Source: MetaStock
Outlook: Immediate resistance is at 34,250. The Dow Jones will need a break and a strong follow-through rise above this resistance to keep up the momentum. Only in that case, the index can see an extended rise to 35,000-35,500 and even 36,000 levels in the coming weeks.
Support is at 33,650. A break below it can bring the index under pressure again. Such a break can take the Dow Jones down to 33,000-32,500 levels again.
Broadly, 33,650 and 34,250 are the important levels to watch this week. A break out on either side of these levels will determine whether the Dow Jones will rise to 35,000-35,500 or fall to 33,000-32,500. It is a wait-and-watch situation for now.


Comments
Comments have to be in English, and in full sentences. They cannot be abusive or personal. Please abide by our community guidelines for posting your comments.
We have migrated to a new commenting platform. If you are already a registered user of TheHindu Businessline and logged in, you may continue to engage with our articles. If you do not have an account please register and login to post comments. Users can access their older comments by logging into their accounts on Vuukle.