Nifty 50 and Sensex witnessed a strong bounce last week. This was contrary to our expectation to see a fall. Though the indices witnessed a subdued start, they picked up momentum in the second half of the week. Both the Sensex and Nifty 50 have closed over a per cent each.
Among the sectors, barring the BSE Metals and BSE FMCG indices, others closed in green. These two indices were down 0.48 per cent and 0.73 per cent respectively. The BSE Auto index outperformed by surging 4.97 per cent. This was followed by the BSE Oil & Gas index, which was up 3.15 per cent.
Watch the FPIs
The foreign portfolio investors (FPIs) were net sellers of Indian equities last week. However, the quantum of selling was less though. The FPIs sold about $84 million in equities. For the month, the FPIs have pulled out about $455 million from the equity segment. The FPI action in the coming weeks will need a close watch. If they begin to pump in money again, then the Sensex and Nifty can rise to new highs from here.
Nifty 50 (22,040.70)
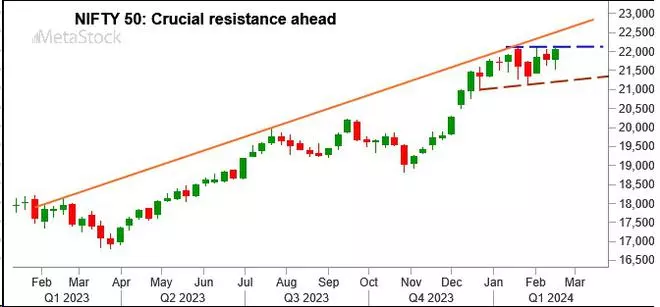
Nifty fell initially last week. However, it found strong support around 21,500 and rose back sharply in the second half recovering all the initial loss. The index touched a high of 22,068.65 on Friday before closing the week at 22,040.70, up 1.19 per cent.
Short-term view: The bounce from around 21,500 is a positive. However, an important resistance is around 22,150 which can be tested initially this week. Whether Nifty is managing to breach this resistance or not will decide the next leg of move.
A break above 22,150 will be bullish. Such a break can take the Nifty up to 22,600-22,700. On the other hand, failure to breach 22,150 and a reversal thereafter can drag the index down to 21,500 again. A break below 21,500 will take the Nifty down to 21,300-21,200 and even 21,000 in the short term.
Overall, the price action around 22,150 will need a close watch to see whether Nifty will continue to move up or reverse lower again.

Graph Source: MetaStock
Medium-term view: From a big picture perspective, we do not see much room left of the upside from here; 22,700 and then the region around 23,500 are strong resistances that can halt the current uptrend. We expect the Nifty to see a strong correction from either of these two levels mentioned above. That can take the Nifty down to 21,000-20,000 in the coming months.
In case the Nifty fails to breach 22,150 now, then it can remain vulnerable for a correction from here itself.
So, although there is room to rise from here, market participants will have to be very cautious for a reversal rather than being overly bullish.
From a long-term picture, 20,000-19,500 is a strong support zone. So, the corrective fall to 20,000 will give a very good long-term buying opportunity going forward.
Nifty Bank (46,384.85)
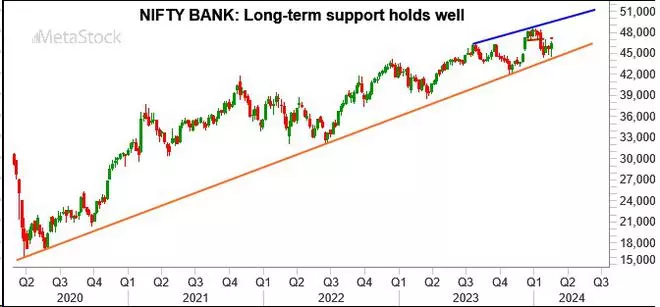
Nifty Bank index has found strong support around 45,000 over the last couple of weeks. The index fell to a low of 44,633.85 on Monday, but then managed to rise back and close the week on a positive note. Nifty Bank index has closed at 46,384,85, up 1.64 per cent.
Short-term view: Immediate support is at 45,650. Crucial resistance is around 47,200, which can be tested this week. The price action thereafter will need a close watch.
If the Nifty Bank index manages to breach 47,200, the upmove can gain momentum. In that case, 47,700-47,800 can be seen first. An eventual break above 47,800 can take the Nifty Bank index up to 49,000-49,500 in the short term.
On the other hand, if the index reverses lower from around 47,200, it can fall back to 45,500-45,000 again. In that case, the chances of seeing 44,000 on the downside will also remain alive.

Graph Source: MetaStock
Medium-term view: The region between 44,000 and 43,500 is a very strong support zone from a big picture perspective. As long as the index stays above this resistance zone, the broader uptrend will remain intact. Nifty Bank index can target 53,000, going forward. But the big question is when this rise will happen — whether immediately or after some consolidation.
Looking at the monthly candles, 44,450-48,650 has been the broad trading range since December. So, the chances of this sideways consolidation continuing for some more time cannot be ruled out. As such, even if a fall to 44,000 happens from here, that will be a good buying opportunity from a long-term perspective.
So, broadly, the index is currently range bound. The bias is positive to see a bullish breakout of this range. This breakout can either happen immediately or after some more months of consolidation.
Sensex (72,426.64)
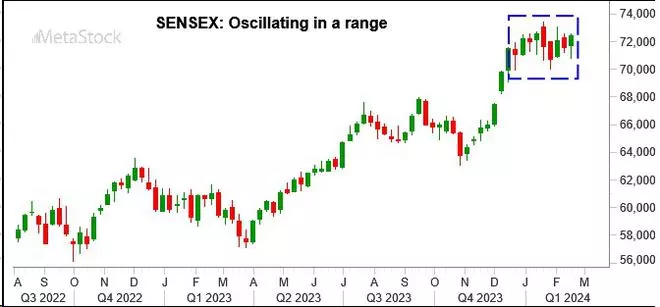
The fall to 70,000 that was mentioned last week did not happen. Instead, the Sensex found strong support in the 70,900-70,800 region and has risen back well. The index made a high of 72,545.33 before closing the week at 72,426.64, up 1.16 per cent.
Short-term view: Immediate resistance is at 72,750. A break above it can take the Sensex up to 73,200-73,500 in the near term. A further break above 73,500, if seen, can take the index up to 73,800-73,900 in the short term. The price action thereafter will need a close watch. Failure to breach 73,900 can drag the Sensex down to 21,000 again.
In case the Sensex fails to breach 72,750 now, it can fall back to 71,000-70,800 again. A break below 70,800 can then drag the Sensex down to 70,000 eventually in the coming weeks.

Graph Source: MetaStock
Medium-term view: Crucial resistance is in the 73,800-74,200 region. Sensex has to surpass this hurdle to gain fresh momentum. Only in that case, a rise to 78,000 and higher levels will come into the picture. For now, we expect the upside to be capped at 73,800-74,200. As such, Sensex can see a fall to 70,000-69,000 either from around 72,750 itself or after an extended rise to 73,800-74,200. The chances of this corrective fall extending beyond 69,000 will have to be seen.
Dow Jones (38,627.99)
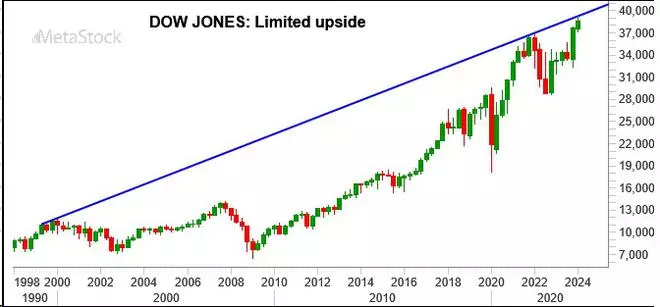
The Dow Jones Industrial Average fell sharply on Tuesday breaking below the support level of 38,500. However, the index managed to reverse higher again from the low of 38,039.86, recovering most of the loss. The Dow Jones has closed the week at 38,627.99, down 0.11 per cent.

Graph Source: MetaStock
Outlook: The index has been stuck inside a sideways range over the last three weeks. The trading range has been 38,000 to 38,930. The immediate outlook is not clear. As long as the Dow stays above 38,000, there is room to test 39,400 in the near term. But the price action thereafter will need a close watch.
A strong break above 39,400 can take the Dow Jones up to 40,400. But a reversal from around 39,400 can trigger a sharp correction, going forward. In that case, the Dow Jones will come under danger for a sharp fall to 37,000 and even 36,000 in the coming months.


Comments
Comments have to be in English, and in full sentences. They cannot be abusive or personal. Please abide by our community guidelines for posting your comments.
We have migrated to a new commenting platform. If you are already a registered user of TheHindu Businessline and logged in, you may continue to engage with our articles. If you do not have an account please register and login to post comments. Users can access their older comments by logging into their accounts on Vuukle.