

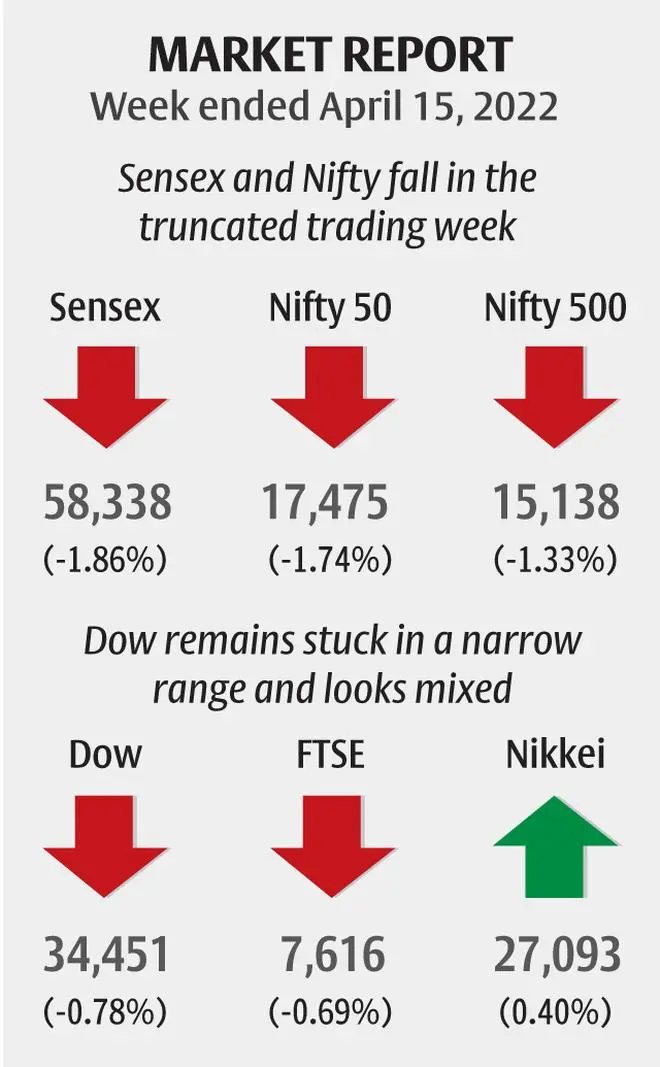
The Indian benchmark indices fell in the truncated trading week. The markets were closed on Thursday and Friday on account of public holidays. Sensex and Nifty 50 fell 1.86 and 1.74 per cent respectively, and have closed the week on a weak note. On the charts, the failure to sustain the rise seen in the week earlier followed by the fall last week is turning the bias negative. This leaves the chances of the Indian benchmark indices falling further in the coming weeks high. So, any intermediate bounce in the coming days can attract fresh sellers coming into the market and cap the upside.
Among the sectors, the BSE Oil & Gas (up 0.73 per cent) and BSE Power (5.2 per cent) ended the week in green. All other sectoral indices fell last week. The BSE IT index fell the most by 3.08 per cent. The BSE Realty and BSE Metal indices fell over 2 per cent each.
Foreign Portfolio Investors (FPIs) turned net sellers of Indian equities after buying for three consecutive weeks. This increases the danger of the FPIs continuing with their selling spree in the Indian equities. The FPIs have been aggressively selling Indian equities since December last year. If the sell-off intensifies in the coming weeks, the Sensex and Nifty can come under more pressure and fall further.
Nifty 50 (17,475.65)
Nifty traded on a weak note all through the week. It broke below the intermediate support level of 17,600 and closed at 17,475.65, down 1.74 per cent for the week.
The week ahead: Immediate support is at 17,432 – the 21-Day Moving Average (DMA). Resistance is at 17,740. The chances are high for the Nifty to remain below 17,740 and break the 21-DMA support. Such a break can take it down to 17,300 and 17,170 – the next two significant near-term support levels.
The region between 17,170 and 17,150 is a crucial short-term support zone that can hold on its first test. A corrective bounce from here to 17,400-17,500 cannot be ruled out.
Trading strategy: Go short now and on a rise at 17,680. Keep the stop-loss at 17,785. Trail the stop-loss down to 17,420 as soon as the index falls to 17,360. Move the stop-loss further down to 17,320 as soon as the index falls to 17,260. Book profits at 17,220
Medium-term outlook: The pull-back from the high of 18,114.65 in the week earlier and a subsequent fall last week keep our broader bearish view intact. This leaves the chances high of the Nifty breaking below 17,400. Such a break can take it down to 16,700 initially. A further break below 16,700 will see the Nifty tumbling towards 15,000.
As mentioned last week, we expect the downside to be limited to 15,000-14,500 now. The chances of seeing 13,500 have been reduced. From a long-term perspective, the fall to 15,000-14,500 will be a good buying opportunity.
Trading strategy: Positional traders can go short now and accumulate at 17,800. Keep the stop-loss at 18,220. Trail the stop-loss down to 17,380 as soon as the index falls to 16,900. Move the stop-loss further down to 16,800 as soon as the index touches 16,100. Book profits at 15,700.
Sensex (58,338.93)
Sensex fell below 59,000 last week and has closed on a weak note. The index has closed at 58,338.93, down 1.86 per cent.
The week ahead: Sensex has closed just below the 21-Day Moving Average (DMA) level of 58,343. Resistances are at 58,900 and 59,350. As long as the index trades below 59,350 the chances are high for it to fall towards 57,960 and 57,495 – the 100- and 200-DMAs respectively.
The region between 57,500 and 57,200 is a significant near-term support zone. A break below 57,200 will increase the downside pressure and drag the Sensex down to 56,000 in the short term.
Medium-term outlook: The pull-back from the high of 60,845 made earlier this month keeps the broader bearish outlook intact. The level of 56,000 is an important short-term support. A break below 56,000 will trigger a steeper fall to 52,000-51,500 over the medium term.
As mentioned last week, we expect the downside to be limited to 50,000 from a bigger picture. Long-term investors will have to look at entering the markets around 50,000 levels.
Nifty Bank (37,463.40)
The Nifty Bank index was stuck in a narrow range last week. The index oscillated up and down between 37,250 and 38,000. It made a high of 37,988.6 on Wednesday and has come off sharply from there, giving back all the gains. The index has closed at 37,463.4, down 0.76 per cent for the week.
The immediate outlook is mixed. 37,250-38,000 will continue to remain as the trading range for some time. A breakout on either side of 37,250-38,000 will give a cue on the next direction of move.
A break above 38,000 can take the index up to 39,000-39,200 in a week or two. On the other hand, a break below 37,250 can drag it down to 36,850 and 36,700 initially. A further break below 36,700 will see the Nifty Bank index declining towards 36,200-36,000. Such a fall will also keep the index under pressure to see a steeper fall to 35,200-35,000 over the medium term.
From a bigger picture, 39,200 and 39,500 are crucial resistances to watch. The Nifty Bank index will have to breach 39,500 decisively in order to boost the bullish momentum. Such a break will pave the way for a fresh rise to 41,750 and 42,000. But as long as the index stays below 39,500, the chances of revisiting 34,000 on the downside cannot be ruled out in the medium term.
Trading strategy: Short-term traders with high-risk appetite can go long on a break above 38,000. Keep the stop-loss at 37,650. Trail the stop-loss up to 38,300 as soon as the index moves up to 38,750. Move the stop-loss further up to 38,650 as soon as the index touches 38,950. Book profits at 39,100.
Global cues
The Dow Jones Industrial Average (34,451.23) has been stuck in between its support at 34,000 and resistance at 35,000. The index has closed the week at 34,451.23, down 0.78 per cent.
The near-term outlook is mixed. A breakout on either side of 34,000 or 35,000 will give a clear picture on the next move. A strong daily close above 35,000 will turn the outlook bullish. Such a break can take the Dow up to 36,000-36,500 in the short term. It will also leave the broader picture bullish. It will leave the Dow with a potential to target 38,000-38,300 on the upside over the medium term.
On the other hand, if the Dow falls below 34,000, it can test 33,700-33,600 initially. A further break below 33,600 will increase the downside pressure and drag the index down to 33,000-32,700 thereafter.
![]() Comments
Comments

Comments
Comments have to be in English, and in full sentences. They cannot be abusive or personal. Please abide by our community guidelines for posting your comments.
We have migrated to a new commenting platform. If you are already a registered user of TheHindu Businessline and logged in, you may continue to engage with our articles. If you do not have an account please register and login to post comments. Users can access their older comments by logging into their accounts on Vuukle.