

The BSE Smallcap index has hit another all-time high (38,915.76) on November 13. But for investors, stock picking in the small-cap space is full of uncertainties and challenges.
Here are 4 charts that provide more insights.
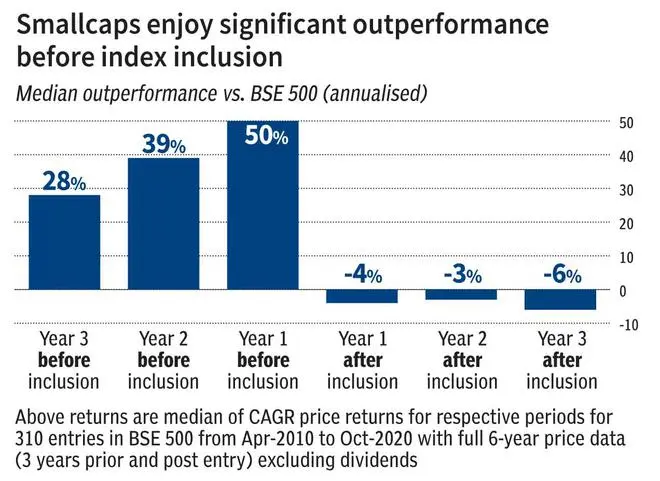
Timing is key
Small-cap companies are stock-exchange listed firms that rank 251st onwards in terms of market capitalisation.
Before being included in the BSE 500, Indian small-cap companies represent one of the most profitable segments in the Indian stock market in terms of long-term returns.
As illustrated in the chart below, these potential entrants outperform the index significantly in the lead-up to their inclusion. However, the excess returns diminish once these companies come under increased market scrutiny.
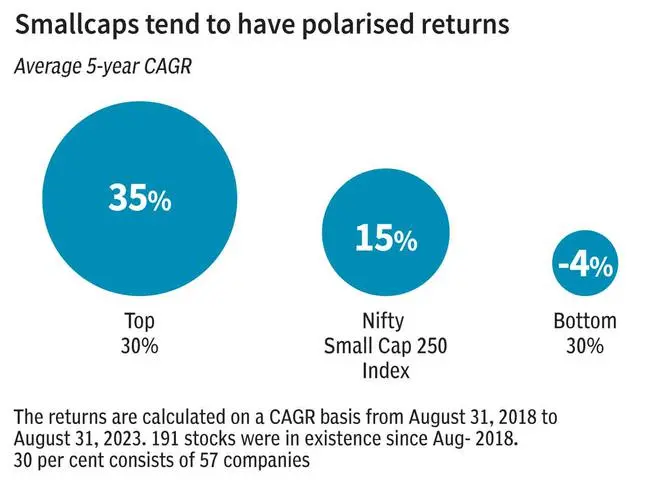
A tale of two halves
Just because you own a small-cap stock for 5 years or more is no sure-shot recipe for success.
As the chart shows below, there is a stark difference between top and bottom performers (average 5-year CAGR) of the Nifty Small Cap 250 index.
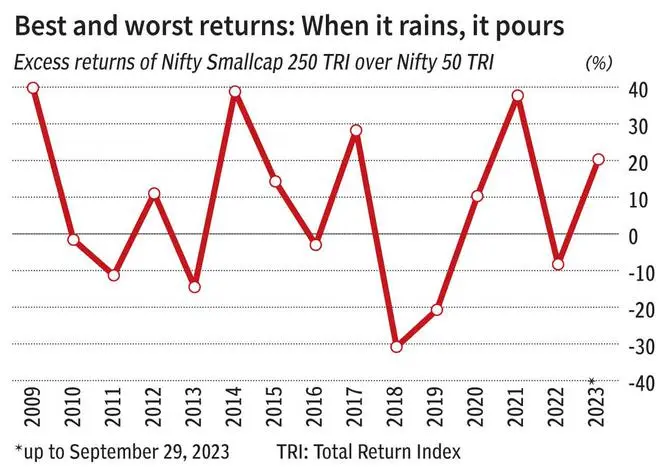
High returns come high risk too
Typically, small-caps tend to outperform large-caps during overall bull market and growing economy. However, they experience higher drawdowns during bear markets too.
The chart below shows the volatile nature of the excess return clocked by Nifty Smallcap 250 index vis-a-vis Nifty 50 benchmark.
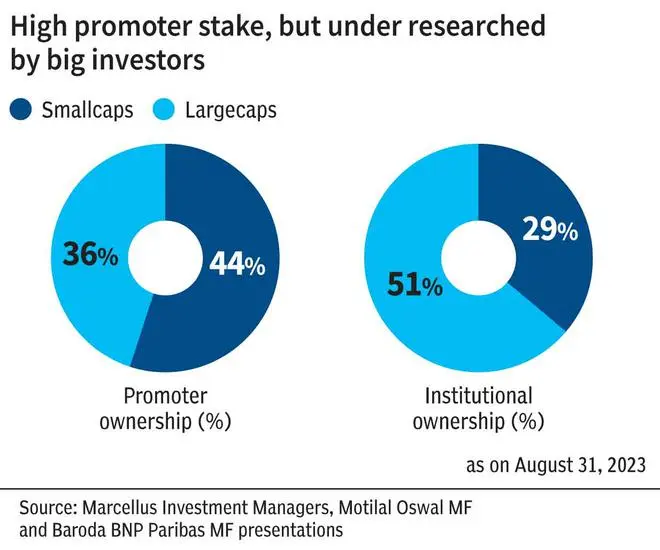
More skin in the game?
Small-cap stocks typically have higher promoter ownership, indicating more skin in the game and possibly, greater alignment of interest.
But, small-caps suffer from low institutional ownership which indicates yet under-researched/un-discovered space. Though this provides an opportunity to invest in good stocks at an early stage, low institutional ownership also is a major risk investors have to contend with.
![]() Comments
Comments


Comments
Comments have to be in English, and in full sentences. They cannot be abusive or personal. Please abide by our community guidelines for posting your comments.
We have migrated to a new commenting platform. If you are already a registered user of TheHindu Businessline and logged in, you may continue to engage with our articles. If you do not have an account please register and login to post comments. Users can access their older comments by logging into their accounts on Vuukle.