The rise in the US Treasury yields over the last three months has occupied centre stage in the global financial markets, influencing movements in other asset classes as well.
The US 10Yr Treasury yield was broadly range-bound between 3.25 and 4.1 per cent from January to April this year. Thereafter it started moving up gradually. In August, the yield breached 4 per cent decisively and made a sharp rise to test 5 per cent in October. This rise since August has taken the dollar index higher from around 102 to 107. The index is currently around 105.
Global equities have run into a strong sell-off. The Dow Jones Industrial Average in the US has tumbled 7 per cent over the last three months (August to October). India’s Nifty 50 fell over 3 per cent during the same period. However, the sharp fall in the US 10Yr yield after the Federal Reserve meeting last week, from around 4.9 per cent to 4.57 per cent now, has given some breather for the indices.
Unlike the stock markets, which have been moving in the opposite direction of the US yields, gold has risen along with it very well in October. This is majorly due to the global market sentiment turning risk-averse after the Hamas-Israel war broke out in the first week of October.
So, where are the US yields headed from here? How can that set the path for the movement in equities, gold or even the Indian government bonds?
To know where the yields are headed from here, we analysed their relative movement with the US Federal Fund Rate since 1971. Taking cues from this data analysis of over thirty years, we project where the equities, commodities and currencies can head to, going forward. For the purpose of forecasting the movement of other asset classes based on how the US 10Yr yield moves, we have taken the period from 2021. The reason for taking 2021 as the start date for the forecast is because, the correlation has been very strong from this time. Secondly, we assume that the external factors such as high interest rates, inflation, etc, which have driven the yeilds higher from 2021 will remain the same for some more time, going forward.
Interest rates at the peak
The rally in the US Treasury yields over the last couple of years has mainly been triggered by the interest rate hikes by the US Federal Reserve. Taking the Fed’s September economic forecast as the base case, the median projection for the fund rate is 5.6 per cent for 2023. The Fed fund rate is currently at 5.25-5.5 per cent. That keeps the door open for one more 25 basis points (bps) increase for this year. The median fund rate for 2024 is 5.1 per cent. Which means that there would be a 50 bps rate cut next year. So, if the 25bps rate hike happens in December, the interest rates can remain flat at the peak for a few months before the rate cut comes into the picture.
Interest rates in the US and the Treasury yields moves in tandem as seen from the chart below. So, with limited room for rate hikes from here, the yields might either have already peaked around 5 per cent or could have little space left on the upside to rise.
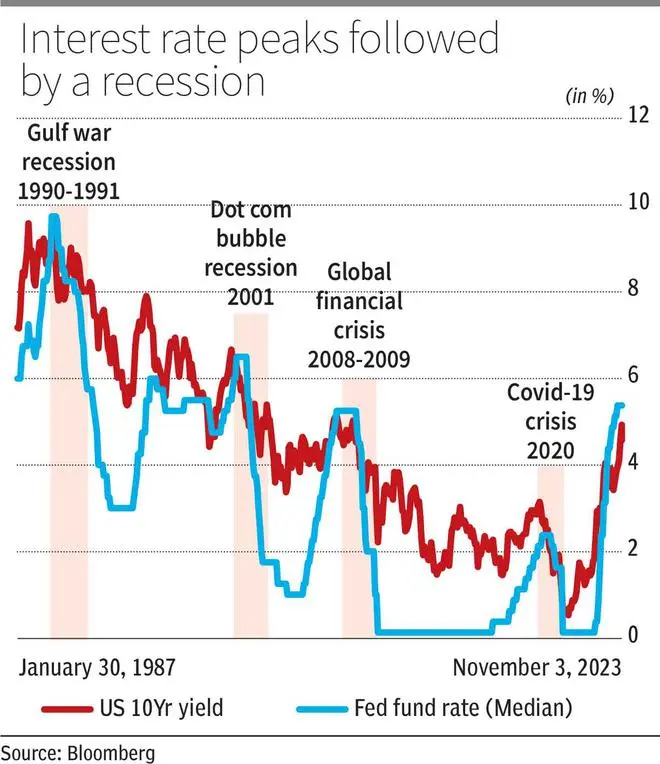
Another interesting fact is that the interest rate peaks in the past have been followed by a recession in the US (see graph above). For instance, before the dotcom bubble in 2001, the Fed Fund rates touched a peak of 6.5 per cent in 2000. Similarly, the global financial crisis of 2008-2009 happened after the US interest rates peaked in 2007 at 5.25 per cent. So, considering the previous instances of interest rate peaks, if history repeats, then there is a possibility of a recession hitting the US by the end of second quarter or in early third quarter of 2024.
So, the base case scenario that we build now considering the above factors is that the interest rates in the US can peak at 5.6 per cent by December this year. The rates can then remain flat in the first quarter of 2024 before the Fed begins to cut rates in the second quarter.
US 10Yr Yield forecast
Considering the possibility of one more rate hike in December, we expect the downside in the US 10Yr Treasury yield to be limited to 4.5 per cent for now. The yield can rise towards 5 per cent again, though. A break above 5 per cent can take it to a high of 5.3-5.5 per cent, assuming that the yield has not peaked yet. Thereafter, as the interest rate starts to come down and in the scenario of a recession hitting the US next year, the 10Yr yield can come down to 4.8-4.6 or 4.5 per cent again. So, broadly, 4.5 to 5 per cent (narrow) or 4.5 to 5.3/5.5 per cent (broad) is the range that we expect for the US 10Yr yield, going forward.
So, as the yields go back up to 5 per cent or 5.3-5.5 per cent and then come down to 4.8-4.6/4.5 per cent, how would that impact other asset classes? Here’s our forecast based on the correlation and technical analysis.
Dollar to remain strong
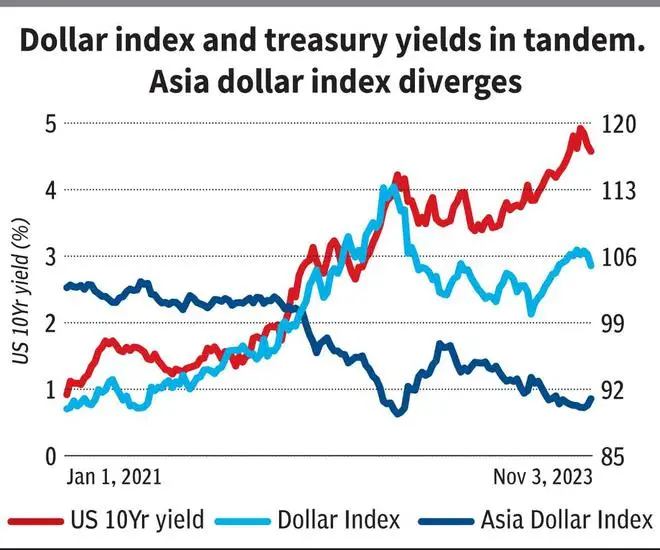
Since 2000, the US dollar index and the 10Yr Treasury yield has a strong directional correlation of 80 per cent. In between, the period 2007 to 2015 was an exception when there were some divergences. Currently the directional correlation is strong since 2021. It is at 87 per cent
So, the expected rise to 5-5.5 per cent in the 10Yr yield can take the dollar index (105) up to 108 or even 110 by the first quarter next year. Thereafter, as the yields fall, the dollar index can come down to 105-103 again.
What does it mean for the Indian Rupee? The Bloomberg Asia Dollar Index (91) has a high negative correlation with the US yield. The correlation has been -95 per cent. The index can fall to 89-88.50 if the yield moves up to 5-5.5 per cent.
Indian rupee has a 10 per cent weightage in the index. The domestic currency has been resilient for some time now. It has been stuck in a very narrow range of 82.50-83.30 for more than two months now. So, the fall in the Asia Dollar index can keep it below 82.50, going forward. If the rupee breaks below 83.30, then it can see a swift fall to 84.50-85 in the coming months.
More weakness for equities
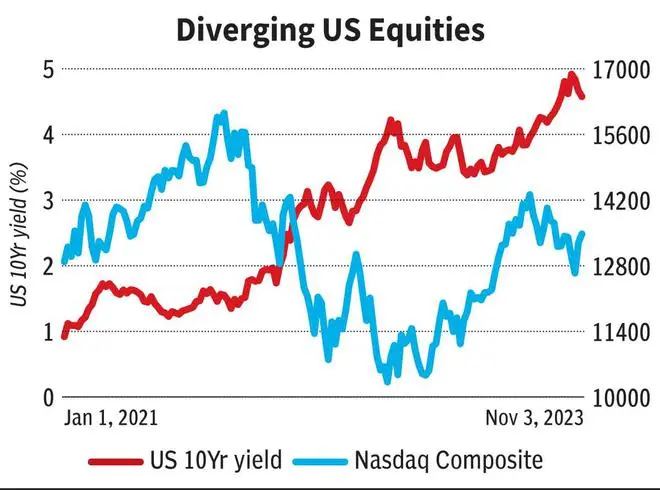
Equities have a mixed relation with the yields. There have been periods when the directional correlation was very strong. For instance, from September 1998 to March 2009, there was a strong positive correlation between the Dow Jones Industrial Average and the 10Yr yield. During this period, India’s Nifty 50 and Nasdaq Composite indices also had a strong positive correlation. But there have been periods like 2014 where there was a divergence between the yields and the equities. Currently, since mid-July this year, the Dow Jones is moving opposite to the yields. Nifty is behaving similarly since mid-September.
So, as long as the yields and the interest rates stay higher around 5 per cent, the equity markets can continue to remain under pressure. Also, if there is going to be a recession next year, there could be a prolonged slowdown in the equities.
Given this background, the upside in the Dow Jones (34,061) can be capped at 35,000-36,000. The index could remain weak for a fall to 32,000 and even 30,000 in the worst case before a strong reversal happens.
Nasdaq Composite (13,478) can fall to to 12,000-11,500. Upside can be capped at 14,000-14,500
On the domestic front, the upside in the Nifty (19,230) can be capped at 20,000-20,500. Nifty can fall to 18,000 in the coming months. Thereafter a fresh rally can begin.
Gold to glitter
Like equities, directionally, correlation of gold with the US yields has been mixed. For instance, from 1988 to 1998, gold had a good positive directional correlation with the US 10Y yield, of about 65 per cent, whereas 2016 to 2022 was a period of strong divergence.

The correlation during this period was -39 per cent. Recently, over the last one month, gold is also rising along with the yields. This is due to the high risk-averse sentiment in the market on the back of the Hamas-Israel war.
Considering the advantage of being a safe-haven now, gold can continue to stay higher even if the yields move up. Gold has potential to touch $2,100-2,150 in the coming months. Thereafter it can fall back again.
Crude to hit $100
Oil price is having a good directional correlation of about 65 per cent with the US 10Yr yield, especially since 2016. The production cuts from the major oil producers is a major reason for the recent rally in the crude prices.
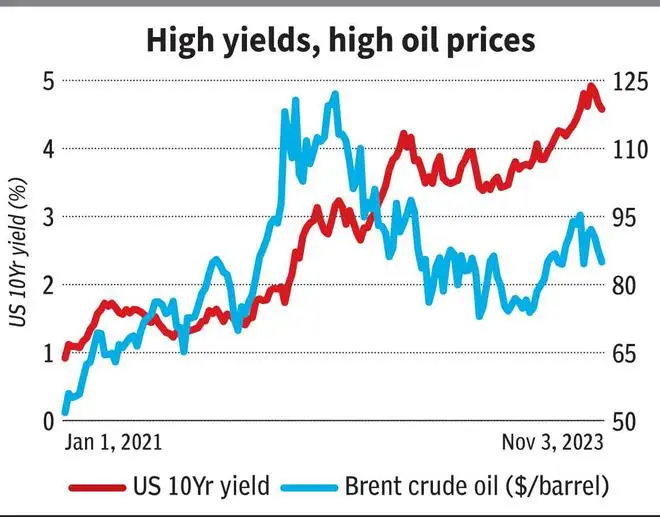
To the extent the yields remain higher and move up, oil prices can move up and stay higher. In addition to this, supply disruption worries on the back of the Hamas-Israel war can also push the oil prices higher. So, Brent Crude oil ($85 per barrel) has high chances of going up to $100 and even $105 in the coming months. Then, if recession comes in, oil prices can fall back below $100 on weak demand.
More upside for Indian yields
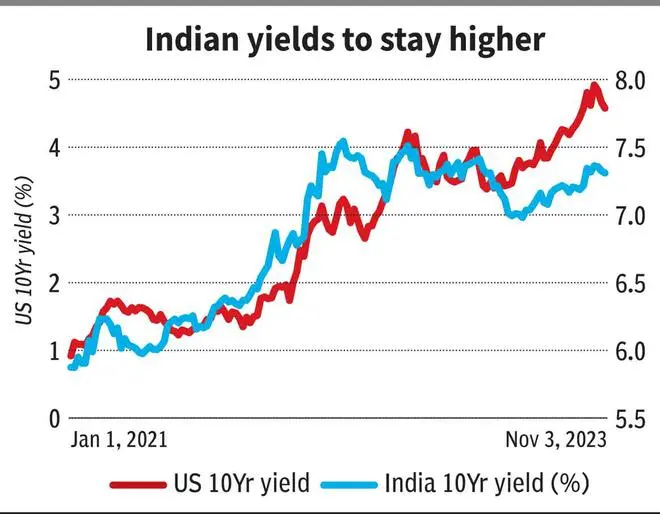
India Government Bond (IGB) 10Yr yield has good directional positive correlation with the US 10Yr yield, especially since 2020. The correlation during this period has been 91 per cent. So, the expected rise in the US 10Yr yield can take the IGB 10Yr (7.31 per cent) up to 7.5-7.6 per cent in the next few months. Thereafter, as the US yields start to come down, the IGB 10Yr can also fall back to 7.3-7.2 per cent in the first half next year.


Comments
Comments have to be in English, and in full sentences. They cannot be abusive or personal. Please abide by our community guidelines for posting your comments.
We have migrated to a new commenting platform. If you are already a registered user of TheHindu Businessline and logged in, you may continue to engage with our articles. If you do not have an account please register and login to post comments. Users can access their older comments by logging into their accounts on Vuukle.