

As States begin their annual budget-making exercise, they are increasingly faced with a daunting task in managing their finances. With the spending on social welfare schemes taking precedence ahead of the elections and States’ own tax and non-tax revenues growing at a sluggish pace, attention inevitably turns to their share in the divisible pool of union taxes, grants, and loans from the Centre.
The debate over inequity in how revenue is shared between States has become quite loud of late with some Southern States recently protesting in the National capital. States such as Karnataka, Kerala and Tamil Nadu have been especially vociferous in criticising the formula used by the finance commissions, which perversely incentivises states which have not checked their population growth or achieved a brisk pace of growth.
We did a deep dive to see if the revenue-sharing formula is really equitable. We find weights given to population and area have been going up since 2005 and share of all four southern states have fallen over the last two decades. While criteria such as demographic performance and income distance have been introduced, they are not enough.

Population & area
The Sixteenth Finance Commission has its job cut out when it begins work on the revenue sharing in the next five-year period.
The primary task of the Finance Commission is to distribute revenue equitably so that States which are unable to generate enough own tax revenue have sufficient resources to fund the development in their region and take care of the needs of their population.
“The Commission sought to balance the principles of fiscal needs, equity and performance for determining the criteria for horizontal sharing,” reads the Fifteenth Finance Commission.
If we look at Table on how weights changed in the devolution formula across finance commissions, we can see income distance has the largest weight in the devolution formula. It was quite high at 62.5 in 2005.
Though the weight for income distance has been lowered subsequently, as States’ resource-generation capacity improved, it is still quite high 45 per cent weight. Income distance is calculated by deducting the GSDP per capita of a state from the GSDP per capita of the state which scores the highest on this metric.
The high weight for income distance cannot be faulted as the principle of federalism requires wealthier states to share their excess revenue with the not-so-wealthy states for overall development of the nation. But the increasing weight given to population and area has made the revenue share tilt towards larger states, with more area.
Weight for the population in the devolution formula was just 10 per cent under the Eleventh Finance Commission (2000-05). This has been increased sharply to 25 per cent by the 12th Finance Commission (2005-10), under the UPA regime.
The Fifteenth Finance Commission has given a lower 15 per cent weight to the population and 12.5 per cent weight to demographic performance. Now, demographic performance is calculated by looking at the TFR (total fertility rate, which captures number of children born to each woman) of States and is intended to reward States which have controlled growth in population.
However, the formula for calculating the weight for demographic performance inverses the TFR and multiplies it by the population in 1971. This results in higher weight once again going to more populous states such as Uttar Pradesh and West Bengal.
Similarly, the weight given to the area has also doubled from 7.5 per cent under the 11th Finance Commission to 15 per cent under the Fourteenth Finance Commission. This tilts the scales in favour of States with large area, and is unfavourable to States such as Kerala which have a much smaller area.
The Fifteenth Finance Commission has introduced 2.5 per cent weight for States which improve their tax and fiscal performance. But the weight for fiscal discipline was much higher at 17.5 per cent under the Thirteenth Finance Commission.
South’s loss
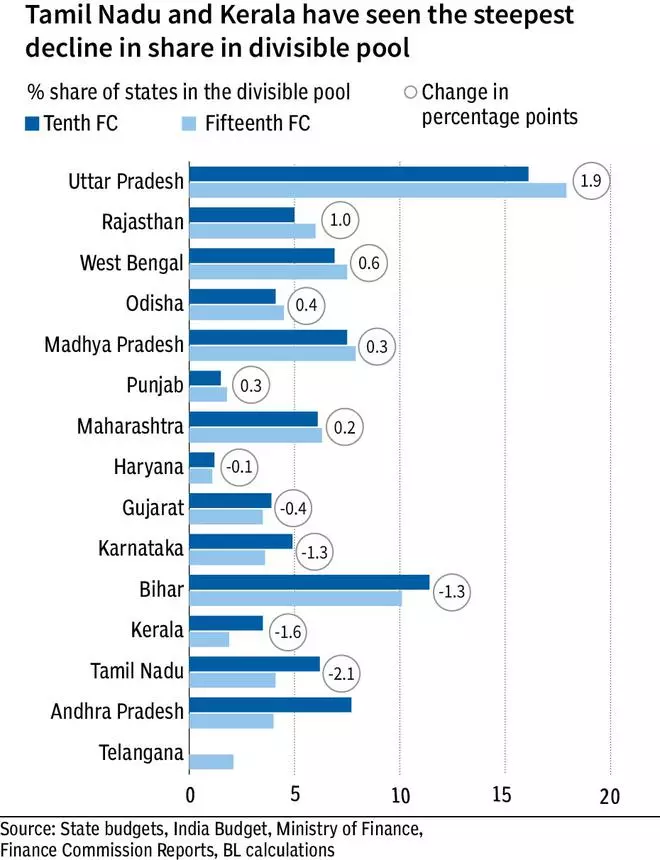
With such a small weight for improving their fiscal condition, States are unlikely to take much effort to reduce their fiscal deficits or improve tax collections. The changing weights in the devolution formula seem to be hurting the southern states more. If we compare the share of states in the Tenth Finance Commission (between 1995 and 2000) and Fifteenth Finance Commission (between 2021 and 2026), the share of all southern states has dipped significantly.

The share of Andhra Pradesh, Tamil Nadu, Kerala and Karnataka in the divisible pool declined by 1.6, 2.1, 1.6 and 1.3 percentage points. We consider the combined share of AP and Telangana in the 15th FC to arrive at the difference.
Bihar too had a loss of 1.3 percentage points, but still Bihar has the second highest share in the divisible pool at 10.1, following Uttar Pradesh, which currently has the largest share of 17.9 per cent.
Devolution formula
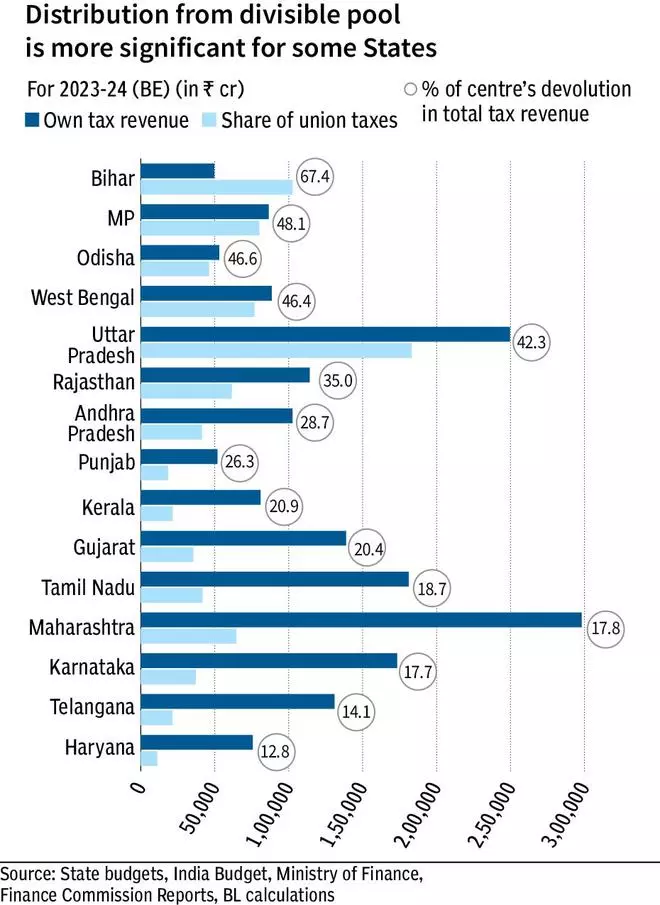
Data from state budgets show that some States are getting a far larger share from the divisible pool, owing to the current devolution formula. For instance, the budget estimates for FY24 suggest that Bihar is set to receive a massive ₹1.02-lakh crore as the Centre’s tax share.
This amounts to 67.4 per cent of the State’s total tax revenue. UP’s share is equally humungous at ₹1.83-lakh crore, which is 42 per cent of the total tax revenue.
On the other hand, in Haryana, the share of Union taxes was just ₹11,164 crore (13 per cent of the total tax revenue). In Telangana, it was ₹21,471 crore. In all southern states, the share from the centre’s divisible pool formed less than 30 per cent of their total tax revenue.
In a written response in the Rajya Sabha on February 9, the Ministry of Finance shared the data on GST and direct tax collected by states between FY19 and FY23. businessline’s calculations based on this data show that the amount of money that states contribute to the Centre’s divisible pool and what they receive back as devolution aren’t the same. For every rupee that goes into the pool, some states get a lot more than others.
While Bihar received ₹7.26 and UP got back ₹2.49 for every rupee that went into the Centre’s pool, Maharashtra, Haryana and Karnataka received 8 paise, 14 paise and 17 paise respectively. Gujarat received 26 paise and Tamil Nadu got back 28 paise. However, the amount that these States get back could be lower, since the calculations haven’t taken excise and customs duties into account. This is because a state-wise break-up of this data isn’t available.
Fair or not?
Some economists think that the weights given to the population are quite fair, since more populous states need to spend more on basic needs. “Furthermore, the Fifteenth Finance Commission has used the data from the 2011 census because the 1971 census doesn’t make sense any more,” says Abhishek Malhotra, an Assistant Professor of Economics at the University of Delhi.
Economist Mary George, the former chairperson of the Kerala Public Expenditure Review Committee thinks that the share lost by southern states by considering 2011 population was made up by the demographic performance criteria. However, she thinks that weightage of demographic performance can be raised to 15 to 20 per cent. She also thinks that weightage given to ‘income distance’ must be reduced, as that may help southern states with a higher per capita income.
![]() Comments
Comments

Comments
Comments have to be in English, and in full sentences. They cannot be abusive or personal. Please abide by our community guidelines for posting your comments.
We have migrated to a new commenting platform. If you are already a registered user of TheHindu Businessline and logged in, you may continue to engage with our articles. If you do not have an account please register and login to post comments. Users can access their older comments by logging into their accounts on Vuukle.