

We are increasingly in an economy in which policy making occurs as shooting into the dark, simply because we no longer have so much of the data that are essential for any public intervention. The collapse of the most essential statistical information in a country that pioneered the collection and evaluation of economic and other data in largely informal economic settings is more than troubling.
It amounts to not just a tragic decline in a once-proud statistical system, but a real obstruction to any evidence-based policy making, and even a lack of awareness of the actual conditions of the Indian people.
For example, we have no reliable estimates of people’s consumption and therefore of poverty and inequality. The large consumer expenditure surveys of the National Sample Survey Organisation (NSSO) that enabled such measures were meant to be conducted every five years, and there was even talk of making the large surveys annual. However, the latest survey in 2017-18 was rejected by the government even after it had been approved by the National Statistical Commission, and the results were never officially made public. (A leaked version of the prepared report suggested that rural consumption spending had fallen between 2011-12 and 2017-18.)
Data gaps
It could be expected that the government would immediately get a new survey done, but this has not occurred even to date. So the latest reliable information we have on household spending is for 2011-12, that is as long as 12 years ago!
We don’t even know how many people there are in the country, or their age or gender, or where they live or what they do or what basic conditions they live in. This is because the decennial Census has been postponed, supposedly because of the pandemic, but now indefinitely without any clear date being set.
As a result, policy makers and implementers are forced to rely on extrapolations from the last census that occurred in 2011, which is a dubious and potentially misleading measure. The major upheavals that have occurred in economy, polity and society would have had significant impact on demographic trends, but as of now we simply do not know.
In consequence, we also do not know how the pandemic, the lockdowns and the subsequent increase in food and fuel inflation have affected people’s consumption and income poverty. Micro surveys and family health surveys point to worsening nutritional indicators, but we simply do not have the large scale survey data that would enable a more general sense of the conditions.
The only major source of information from large sample surveys that remains is from the Periodic Labour Force Surveys of the NSSO. These are now conducted over rounds spread over four quarters of the year, and provide data on employment rates, unemployment rates and remuneration. These enable us to get at least some sense of what is happening in labour markets and to wages, salaries and income from self-employment.
Casual workers are widely seen to be the worst affected during the Covid-19 pandemic, so it is worth exploring the changes in wages of casual workers just before, during and after the pandemic.
In these figures, we have used the quarterly wage data from the Annual Reports of the Periodic Labour Force Surveys, deflated by the Consumer Price Index for rural and urban workers, respectively. The data provided here present trends in real wages, in terms of prices of the base period of July-September 2018.
Figure 1 presents data on trends in real wages of casual workers (other than those engaged in public works) by rural and urban location. It shows several features of interest.
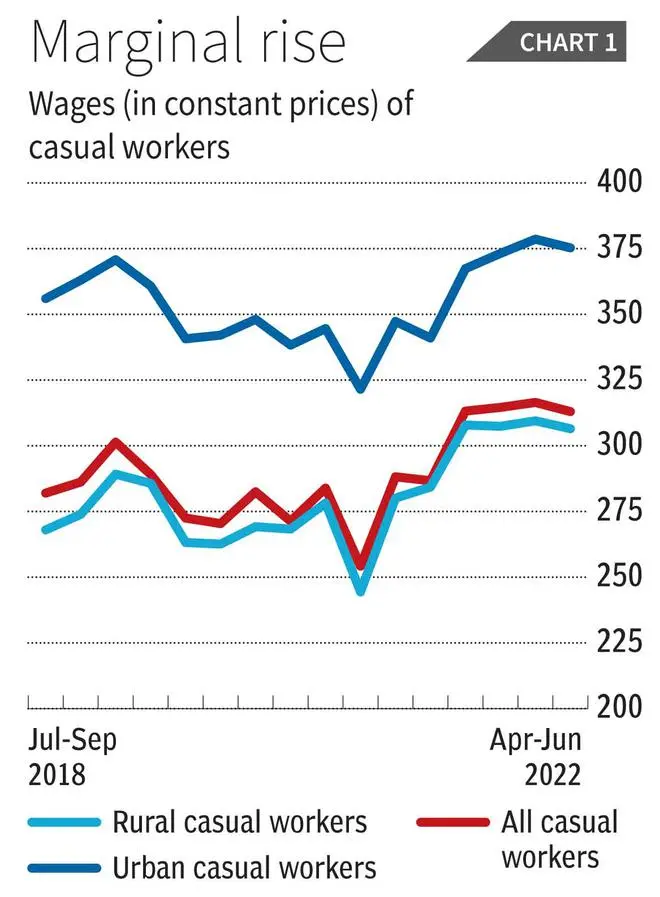
First, real wages in both rural and urban areas had started declining well before the pandemic, declining by more than 9 per cent in rural areas between January-March and July-September 2019, and by just under 6 per cent in urban areas.
Of course the pandemic impacted labour markets drastically, with wages declining through 2020, and especially sharply in October-December 2020. Remember that this was the period when lockdowns had been largely lifted, but the negative multiplier effects of the closures and associated decimation of small and micro enterprises was fully in play.
Thereafter real wages recovered — more so in rural areas — but remained relatively stagnant after the initial bounce back in early 2021. As a result, in the quarter April-June 2022, real wages of rural casual workers were less than 6 per cent higher than the earlier peak achieved in January-March 2019, while urban casual workers’ wages had only increased by 1.2 per cent. Note that over this period, GDP in constant terms is supposed to have increased by around 11 per cent, according to the CSO.
Figure 2 show the real wage trends disaggregated by gender. These show a similar pattern, of decline starting before the pandemic, extreme decline during the pandemic and only sight recovery in the most recent period. It is interesting that the wage recovery for male casual workers has been even less than that for women workers.
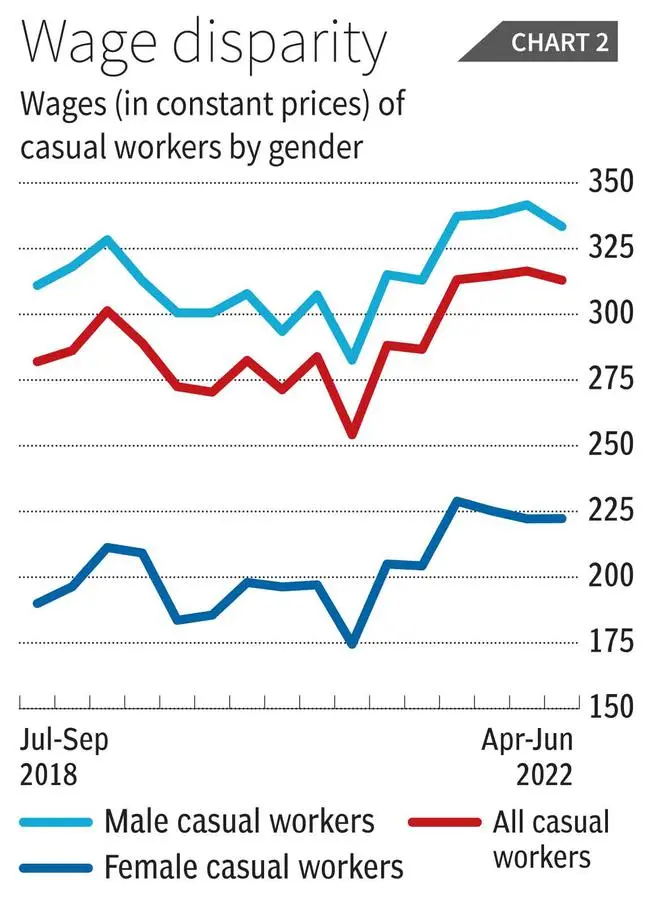
In April-June 2022, male casual workers wages in constant price terms were only 1.5 per cent higher than in the previous peak of January-March 2019, while those of women casual workers were higher by 5.2 per cent.
Gender gulf
This is reflected in the reduction of the gender wage gap, as indicated in Figure 3, which shows female wages as a per cent of male wages. Remember that India has one of the highest gender wage gaps in the world, so even with the recent increase, the gap is still larger than the world average.
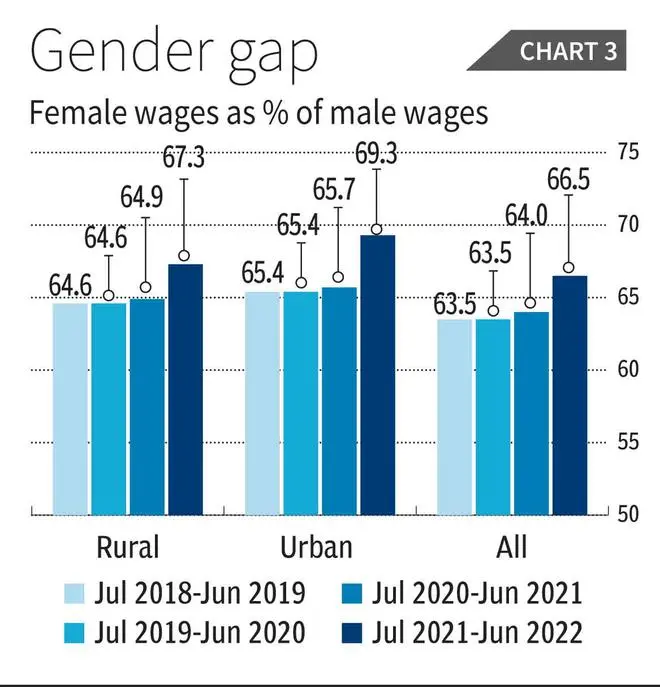
However, it is also the case that the recent period has seen a further decline in women’s recognized work force participation from already very low levels. It is possible that even among casual workers, the rise in average wages reflects the fact that fewer women at the bottom of the wage spectrum were able to retain their employment or find work.
Another aspect worthy of note is the apparent convergence across rural and urban areas in terms of wages, as indicated from Figure 4.
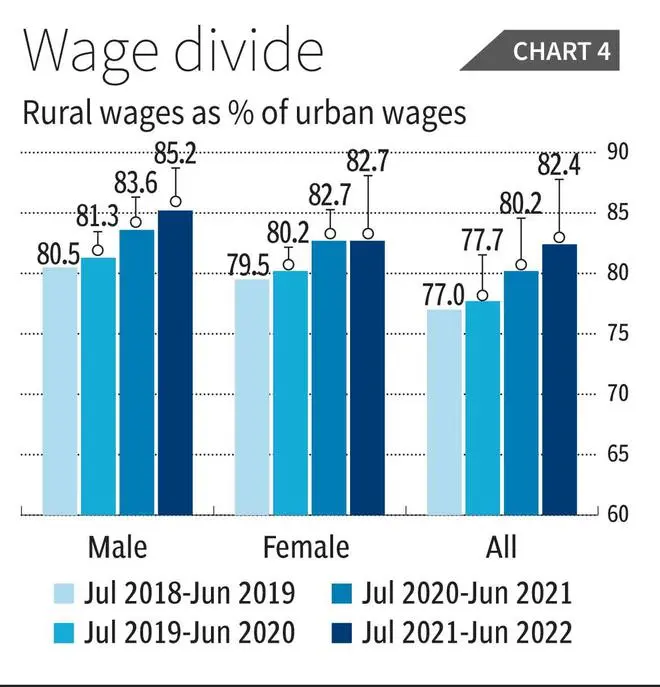
This is more marked for male workers than female workers. This is clearly a feature that deserves further exploration about possible causes as well as regional variations.
Overall, the broad tendency that emerges is that of wage movements that are not keeping pace with GDP increases, pointing to worsening bargaining power of casual workers and in providing one more indication of increasing economic inequality within the country.
![]() Comments
Comments

Comments
Comments have to be in English, and in full sentences. They cannot be abusive or personal. Please abide by our community guidelines for posting your comments.
We have migrated to a new commenting platform. If you are already a registered user of TheHindu Businessline and logged in, you may continue to engage with our articles. If you do not have an account please register and login to post comments. Users can access their older comments by logging into their accounts on Vuukle.