

The Indian benchmark indices, the Sensex and Nifty 50, rose to new highs last week. But prior to this rise last week, Sensex and Nifty 50 were stuck in a broad range for more than three months. Even after last week’s rise, the Sensex and Nifty are up just 4.4 per cent and 5.6 per cent for this year so far.
But if we look beyond the benchmarks, many broader indices have outperformed the Sensex and Nifty so far this year. For instance, the Nifty Next 50 index has surged 29 per cent. Nifty 500 and Nifty 100 index are up about 10 per cent each so far this year. If you are looking to participate in the broader market outside the bellwethers through index funds and ETFs, here’s our view on key indices based on technical analysis.
The indices that we have covered here are Nifty 100, Nifty Next 50, Nifty 500, Nifty Smallcap 250 and Nifty Midcap 150. We have done a long-term technical analysis on these indices. The levels at which investors can enter the indices and the targets for the same are also given here. Depending on the strength on the charts and after giving weightage on probability of move from current levels, we have split the quantum of money to be chosen for each of the entry levels.
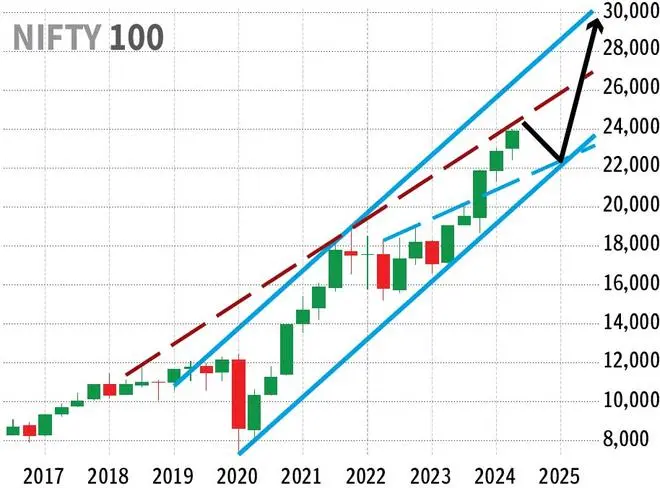
Nifty 100: Bullish. Buy now and on dips
After surging 20 per cent last year, the Nifty 100 index has continued to move up this year as well. Although the momentum seems to have slowed down slightly this year, the uptrend remains intact. The index had surged to a new high of 24,060.75 last week. It is currently at 23,980.10, up 9.4 per cent for the year so far.
Outlook
The uptrend is intact and strong. There is an immediate resistance at 24,270. Even if that holds on its first test, there are good supports to limit the downside, keep the uptrend intact. Support is in the 22,800-22,600 region. Below that, 21,000-20,600 is a much lower support zone.
Nifty 100 index can target 28,000 by the end of this year if it continues to sustain above 22,800. In case there is a correction in the second half of this year, which takes the index below 22,600, then the rise to 28,000 might get delayed.
In this case a fall to 21,000-20,600 is possible in a worst-case scenario. Thereafter the index can begin a fresh leg of long-term uptrend. This rally will have the potential to take the index past 28,000. If that happens, Nifty 100 index can target 30,000 sometime in the first or second quarter next year.
The uptrend will come under threat only if the Nifty 100 index declines below 20,600. Such a break, though less likely, can drag the index down to 19,500.
Strategy
Long-term investors can get into this index in three tranches. Buy now at current levels for about 20 per cent of the intended amount. Accumulate another 60 per cent on dips at 23,000 The balance 20 per cent can be bought at 21,300.
Nifty Next 50: Ripe for a correction?
Nifty Next 50 has made a sharp rise this year. The index was up 26.45 per cent last year. It has beaten this return in just five months this year. Nifty Next 50 index, currently at 69,033.25, is up 29.41 per cent so far this year. The index has been making new highs every month this year. Last week, it touched a new high of 69,458.95.

Outlook
The rally this year has been so sharp and very fast. Important resistances are ahead for the Nifty Next 50 index. The resistance at 68,900 was just broken last week. Above that, 69,500, 70,500 71,300 are the next crucial resistances.
The rally seems to be nearing an interim top. So, a corrective fall is more likely to happen from anywhere between 70,500 and 71,300. Considering the sharp and swift rise this year, the corrective fall can also be slightly steeper.
On the charts, the supports are also available at much lower levels. The important supports are at 63,000 and 61,800. Below that, 58,000 and 57,000 are the much lower support that can be tested in a worst-case scenario. This corrective fall can spread through the second half of this year. A fresh rally after this corrective fall will have the potential to take the Nifty Next 50 index up to 78,000 and 80,000 by the end of next year or in early 2026.
Strategy
Since the chances of a corrective fall look high, investors can enter with a minimum quantity at first. This is because the other indices have room to rise from here. To cash-in on that possibility we suggest that investors deploy 10 per cent of the money first at current levels. Accumulate another 60 per cent at 62,500. The balance 30 per cent can be deployed at 58,800.
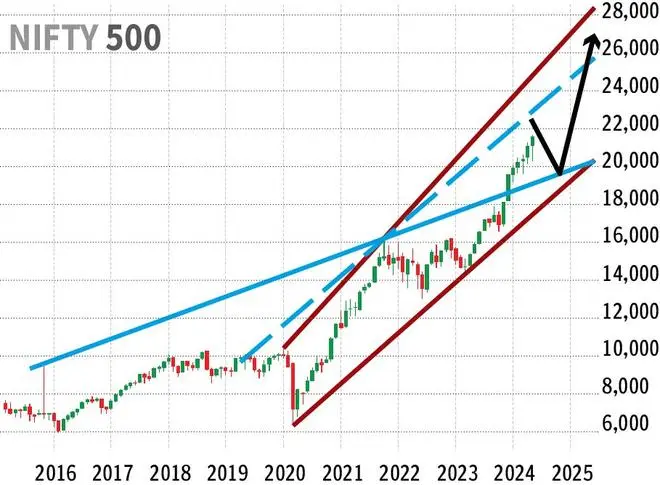
Nifty 500: Buy now and accumulate on dips
Nifty 500 has been in a strong uptrend since April last year. After surging 25 per cent last year, the index is up over 10.57 per cent so far this year. It is currently trading at 21,483.75.
Outlook
The price action on the monthly chart indicates that the index is getting good buyers in the 20,000-19,500 region. That is likely to keep the uptrend intact. Nifty 500 index has room to rise further from here up to 22,500 and 23,000. This 22,500-23,000 can be a good resistance that can halt the current rally. A corrective fall from this resistance zone can take the index down to 21,000 first. A further break below 21,000 will see the fall extending up to 20,000 or even 19,000 in a worst-case scenario. Thereafter a fresh leg of uptrend can begin.
The rise from the 20,000-19,000 support zone can take the Nifty 500 index up to 25,000 in the first quarter next year. From a multi-year perspective, the Nifty 500 index has potential to target 28,000 and higher levels.
Strategy
Investors can buy around 20 per cent of the intended amount at current levels. Wait for a corrective fall. Buy another 60 per cent at 20,500 and the balance 20 per cent at 19,800.
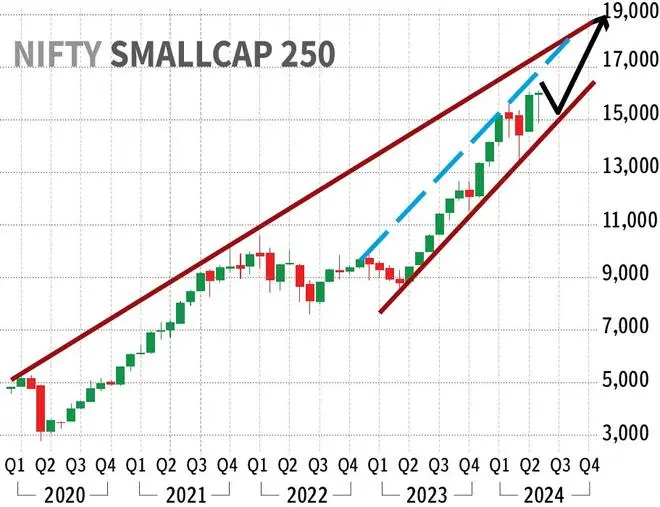
Nifty Smallcap 250: Bullish. Buy now and on dips
After making a stellar rally of 48 per cent in 2023, the Nifty Smallcap 250 index witnessed a 14 per cent correction earlier this year. The index fell from a high of 15,489 (February) to a low of 13,284 (March). But thereafter it has made a strong recovery and is up 13 per cent this year. The index is currently at 15,865.65
Outlook
The uptrend is intact. Immediate resistance is at 16,000. A break above it can take the Nifty Smallcap index upto 16,800 or 17,100. Thereafter we can expect a corrective fall to 15,000 or 14,800. If the sell-off intensifies, then a break below 14,800 can see a steeper correction to 13,600. Though this fall to 13,600 cannot be completely ruled out, it looks less probable as seen from the charts.
As such, a reversal either from 14,800 or 13,600 can trigger a fresh leg of upmove. That rally will have the potential to take the Nifty Smallcap 250 index up to 18,500-19,000.
Strategy
Investors can get into this index at current levels. Buy 40 per cent of the intended amount now. Another 50 per cent can be bought at 14,900. The balance 10 per cent can be deployed at 13,800.
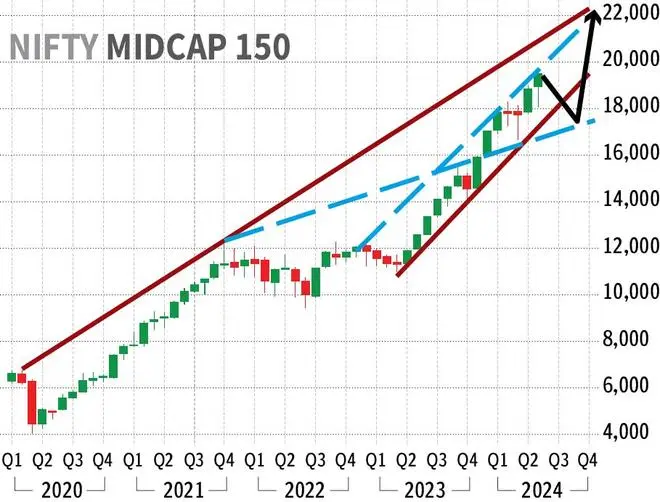
Nifty Midcap 150
Similar to the Nifty Smallcap 250, the Nifty Midcap 150 index also witnessed a corrective fall in the month of February and March this year. But unlike the Nifty Smallcap 250 index which tumbled about 14 per cent, the correction was limited to 9 per cent in Nifty Midcap 150. The index fell from the high of 18,345 (in February) to a low of 16,718 (March). However, it has risen back sharply from there and is currently trading at 19,553.15, up 14.5 per cent for the year.
Outlook
The trend is up and intact. Immediate resistances are at 19,700 and 20,150. If the index turns downwards from any of these two resistances, then there can be a corrective fall. In that case the Nifty Midcap 150 can fall to 18,750 and 18,200. A break below 18,200 though less likely, can trigger an an extended fall to 17,200-17,000. A fresh rally either from around 18,200 or from 17,000 can take the Nifty Midcap 150 index up to 21,000 and 22,000.
Another possibility is the index rising past 20,150 from here itself. If that happens, then 21,000 can be seen straight away. In this case, the corrective fall to 19,000 can happen from around 21,000. If the sell-off worsens, then the downside can extend up to 18,000. Thereafter a fresh rally can take the Nifty Midcap 150 index up to 22,000.
Strategy
Investors can buy 60 per cent of the intended amount at current levels. Buy another 30 per cent at 18,800 and the balance 10 per cent at 18,200.
Action Plan
Based on the above technical analysis on the indices and the levels, investors can strategise on their own to enter into the index funds or ETFs. But make sure to do your due diligence in choosing the correct index fund or ETF based on the liquidity, expense ratio, tracking error and, last but not the least, your risk appetite.
![]() Comments
Comments


Comments
Comments have to be in English, and in full sentences. They cannot be abusive or personal. Please abide by our community guidelines for posting your comments.
We have migrated to a new commenting platform. If you are already a registered user of TheHindu Businessline and logged in, you may continue to engage with our articles. If you do not have an account please register and login to post comments. Users can access their older comments by logging into their accounts on Vuukle.