The Indian benchmark indices managed to hold higher very well last week. Although both Sensex and Nifty 50 oscillated in a narrow range at the beginning of the week, the indices gained momentum towards the end. Sensex and Nifty have closed 1.68 per cent higher each last week.
The strong rise the last two trading days of the week indicates that the uptrend that has been in place since June is very well intact.
Our earlier bearish view of seeing a medium-term fall in both the Sensex and Nifty 50 is getting negated and is not going to happen now. There is an important resistance coming up for the Sensex and Nifty 50. A strong break and a weekly close above it will be very positive from a long-term perspective.
All sectoral indices have closed in green last week. The BSE IT index, which was beaten down badly in the previous two weeks, outperformed last week. The index was up 3.48 per cent. The BSE Metals, BSE Bankex and BSE PSU indices were all up over 2 per cent each.
FPI flows
The Foreign Portfolio Investors (FPIs) continued to buy the Indian equities for the eight consecutive week. The equity segment saw an inflow of $455 million last week. Sensex and Nifty can move further higher as the foreign money continues to flow.
Nifty 50 (17,833.35)
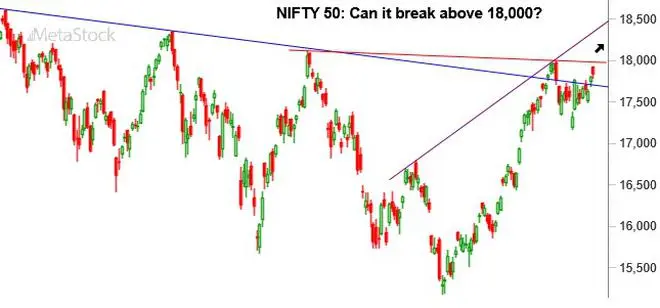
After oscillating around 17,600 in the first half of the week, Nifty broke above the crucial resistance level of 17,700 on Thursday. It made a high of 17,925.95 before closing the week 1.68 per cent up at 17,833.35.

Chart Source: MetaStock
The week ahead: The close above 17,800 is a positive signal. An important resistance is at 18,000. However, there is a strong resistance-turned-support trendline at 17,700. Additionally, the consolidation around 17,600 will make it difficult for the Nifty to break below 17,600. As such 17,700-17,600 will now be a strong support zone.
As long as the Nifty remains above 17,600, the outlook is bullish. As such the chances are high for it to break 18,000 in the coming days. Such a break can take it up to 18,400 this week.
Inability to breach 18,000 immediately can keep the Nifty in the range of 17,600-18,000 for some time.
A much lower support below 17,600 is poised at 17,400.
Trading strategy: Go long now and accumulate on dips at 17,730. Keep the stop-loss at 17,540. Trail the stop-loss up to 17,920 as soon as the index moves up to 18,080. Move the stop-loss further up to 18,120 when the index touches 18,240 on the upside. Book profits at 18,380.
Medium-term outlook: Our medium-term bearish view seems to be getting violated. The fall to 17,400-17,200 expected last week has not happened. A decisive weekly close above 18,000 will confirm the bullishness. It can then take the Nifty up to 19,500-19,700 initially and then to 20,000-20,200 eventually.
Nifty will come under pressure only if it breaks below 17,400. For that to happen, the index has to reverse lower from 18,000 and then fall below 17,600 over the next one or two weeks. The chances of that happening cannot be completely ruled out. But that looks less probable.
Trading strategy: The stop-loss at 18,220 on the short positions recommended last week has been hit.
Sensex (59,793.14)
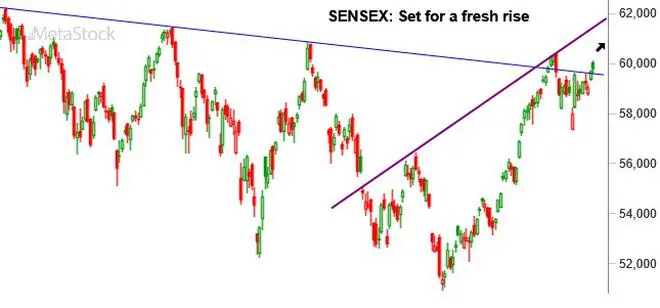
Sensex was struggling to get a strong follow-through rise above 59,000 initially. However, the index gained momentum towards the end of the week and broke above the key resistance level of 59,000. Sensex made a high of 60,119.80 on Friday and had come off from there to close the week at 59,793.14, up 1.68 per cent.

Chart Source: MetaStock
The week ahead: The outlook is bullish. There is a strong resistance-turned-support trend line at 59,580. Below that another important trendline support is at 58,950. Resistance is at 60,500.
The chances are high for the Sensex to sustain above 59,580 itself and break above 60,500 this week. Such a break can take the index up to 61,000. If the Sensex manages to breach 61,000, the upside can then extend up to 61,600-61,700.
The level 58,950 is an important short-term support. The outlook will turn negative only if the Sensex falls below this support. In that case, a test of 59,000 is possible. But such a fall looks less likely.
Medium-term outlook: The medium-term picture is also looking positive with strong supports at 59,000 and 57,000. As such, the chances of seeing 50,000-49,000 on the downside are getting reduced. A strong weekly close above 60,500 will completely negate that fall. In that case, Sensex could gear up for a fresh rally to 64,000 and even higher levels in the coming months.
Nifty Bank (40,415.70)
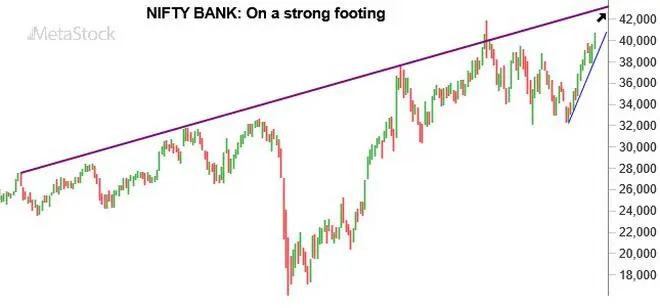
The sideways consolidation that was in place over the last four weeks has been broken. The Nifty Bank index has broken this consolidation on the upside and has closed on a strong note. The index has risen well above the psychological 40,000-mark and has closed at 40,415.70, up 2.52 per cent for the week.

Chart Source: MetaStock
On the charts, the index is looking strong. The outlook is bullish. Immediate support will be at 40,100-40,000. Below that a strong trendline support is at 39,800. Intermediate dips to these supports are likely to see fresh buyers coming into the market. We expect the Nifty Bank index to rise to 40,200-40,300 over the next two to three weeks.
Trading strategy: A positional trade with a holding period of two-three weeks is recommended at the moment. Go long at current levels. Accumulate on dips at 40,180 and 39,940. So, the average entry rate will come around 40,178. Keep the stop-loss at 39,630. Trail the stop-loss up to 40,600 as soon as the index moves up to 41,400. Move the stop-loss further up to 41,600 when the index touches 41,970 on the upside. Book profits at 42,140.
Global cues
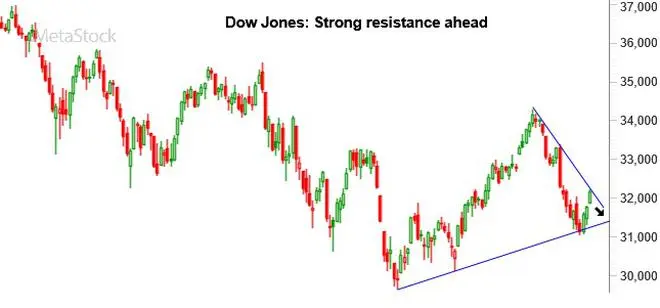
The Dow Jones Industrial Average (32,151.71) has risen back sharply last week recovering almost all the loss made in the week earlier. The index made a low of 31,145.30 on Tuesday and then rose back sharply for the rest of the week. It has closed at 32,151.71, up 2.66 per cent for the week.

Chart Source: MetaStock
However, on the charts, the broader trend is still down. Immediate resistance is at 32,215. The next higher and a strong resistance is around 32,500. The Dow has to see a strong break above 32,500 to become completely bullish.
A reversal either from current levels itself or from around 32,500 will keep the overall downtrend intact. In that case, the danger of the Dow falling to 30,000 and lower levels will still remain alive. As such, the price action this week will need a close watch.


Comments
Comments have to be in English, and in full sentences. They cannot be abusive or personal. Please abide by our community guidelines for posting your comments.
We have migrated to a new commenting platform. If you are already a registered user of TheHindu Businessline and logged in, you may continue to engage with our articles. If you do not have an account please register and login to post comments. Users can access their older comments by logging into their accounts on Vuukle.