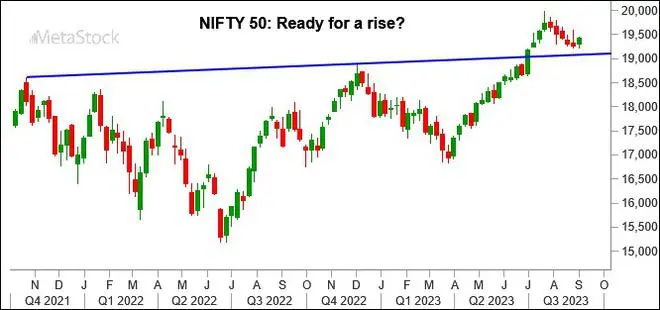
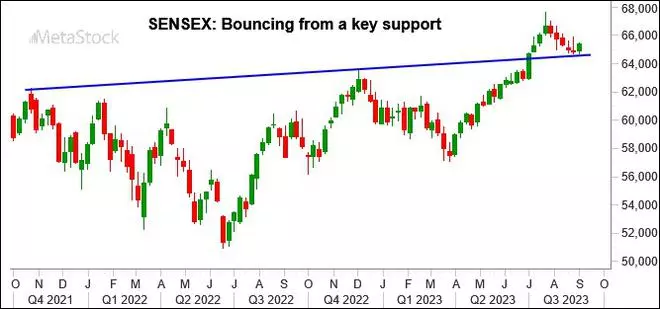
Nifty 50 and Sensex snapped their five-week fall last week. Although the benchmark indices remained under pressure most part of the week, the strong rise on Friday recovering all the loss has given some breather. The price action over the last couple of weeks indicates a strong base formation on the charts. That could be giving an early signal that the recent corrective fall could be coming to an end. As such, we can look for a fresh leg of upmove anytime soon, going forward.
Among the sectors, barring the BSE FMCG index, down 0.51 per cent, others ended the week in green. The BSE Metal index surged the most and was up 6.05 per cent. This was followed by the BSE Realty index, which was up 5.71 per cent.
FPI Flows
The foreign money flows into the equity segment has been very consistent over the last few weeks. The foreign portfolio investors (FPIs) bought $342 million in the equities last week. As we have been mentioning over the last few weeks, the FPIs have been buying the dips. This is very positive for the Indian benchmark indices from a long-term perspective.
Nifty 50 (19,435.30)
The fall to 19,100-19,000 mentioned last week did not happen. Instead, Nifty continues to get support near 19,200 itself. The index made a low of 19,223.65 on Thursday, but then managed to rise back on Friday recovering all the loss. It has closed the week at 19,435.30, up 0.88 per cent, thereby ending the five-week fall.
Short-term view: The price action over the last couple of weeks indicate that Nifty is getting strong support around 19,200. This has reduced the chances of the fall to 19,100-19,000 that we have been expecting over the last couple of weeks. Key resistance to watch is at 19,500. A strong break above it can see a rise to 19,600 immediately. A further break above 19,600 will then pave way for the Nifty to see 19,800-19,850 on the upside in the short term.
Failure to breach 19,500 can keep the index in a range of 19,200-19,500 for some more time. The downside will be limited to 19,100-19,000, incase a break below 19,200 happens.

Chart Source: MetaStock
Medium-term outlook: As long as Nifty sustains above the 19,100-19,000 support zone, the broader picture will continue to remain bullish. Nifty can target 20,200-20,400 in the coming months. The region between 20,200 and 20,400 is a very strong resistance zone. The price action, thereafter, will need a very close watch. Whether Nifty will breach 20,400 or not is going to be crucial in deciding the direction of move thereafter.
The outlook will turn bearish only if the Nifty declines below 19,000. That looks unlikely at the moment in the absence of any strong new negative trigger.
Sensex (65,387.16)
The support at 64,500 continues to hold well. Sensex fell to a low of 64,723.63 and then rose back sharply on Friday recovering all the loss. The index has closed at 65,387.16, up 0.77 per cent for the week.
Short-term view: Currently, there is a range of 64,500-66,000. Sensex can continue to oscillate within this range for some more time. However, the bias is bullish. As such we can expect a break above 66,000, going forward. Such a break can take the Sensex up to 66,650 and 67,000 in the short term.
The short-term outlook will turn negative only if the Sensex declines below 64,500. In that case, a fall to 63,600 can be seen.

Chart Source: MetaStock
Medium-term view: The medium-term outlook will remain bullish as long as the Sensex sustains above 64,500. The index can rise back to 68,300-68,500 in the coming months. A strong break above 67,000 will pave way for this rise.
The price action, thereafter, will need a close watch. Whether the Sensex will surpass 68,500 or not will be crucial in determining the direction of move after that.
The broader uptrend will come under threat if Sensex declines below 64,500. In that case, though less likely, a fall to 62,000 can be seen.
Nifty Bank (44,436.10)
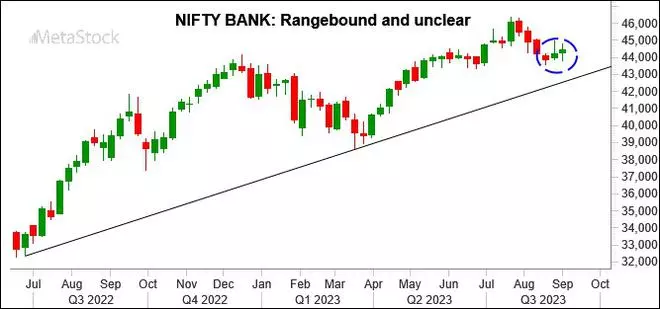
The Nifty Bank index oscillated well within the 43,650-45,000-range mentioned last week. The index made a low of 43,830.75 and has risen back from there to close the week at 44,436.10, up 0.46 per cent.
Short-term view: The 100-Day Moving Average at 44,100 is continuing to provide support. But at the same time, Nifty Bank index is not gaining momentum to breach 45,000. This continues to keep the short-term outlook unclear for the index. Support is at 43,700. So, we can expect the Nifty Bank index to remain in the range of 43,700-45,000 for some more time.
A breakout on either side of this range will determine whether the Nifty Bank index can go up to 46,000-46,500 or fall to 43,000-42,700. We will have to wait and watch.

Chart Source: MetaStock
Medium-term view: The medium-term outlook is bullish with strong support in the 43,000-42,500 region. The index has potential to target 48,650 in the coming months. A break above 46,000 can open the doors for this rise.
Dow Jones (34,837.71)
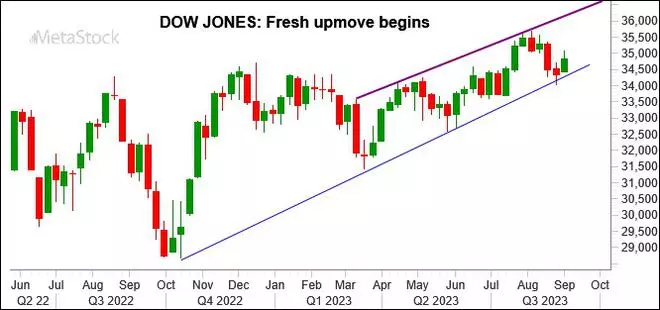
The Dow Jones Industrial Average sustained above 34,000 in line with our expectation. Indeed, the rise to 35,000 also happened last week as expected. The Dow made a high of 35,070.21 and came down from there close the week at 34,837.71, up 1.43 per cent.

Chart Source: MetaStock
Outlook: The outlook is bullish. The index is facing some resistance around 35,000 for now. However, support is there for the week at 34,400. Below that 34,000 will continue to act as a strong support.
As long as the Dow Jones stays above these supports, the chances are high for it to break above 35,000. Such a break can take it up to 35,300-35,500 initially. It will also keep the medium-term picture bullish to target 36,000 and 36,500 eventually.
To turn the outlook bearish, the Dow Jones will now need a strong fall below 34,000. That looks less likely at the moment.


Comments
Comments have to be in English, and in full sentences. They cannot be abusive or personal. Please abide by our community guidelines for posting your comments.
We have migrated to a new commenting platform. If you are already a registered user of TheHindu Businessline and logged in, you may continue to engage with our articles. If you do not have an account please register and login to post comments. Users can access their older comments by logging into their accounts on Vuukle.